


Editor's Note: This story originally appeared on Construction Coverage.
The real estate market since the start of the COVID-19 pandemic has been tough on all buyers, but aspiring first-time buyers may have struggled most of all.
When the COVID-19 pandemic hit, preferences for more living space, increased remote work opportunities, and other factors related to the pandemic encouraged more people to enter the market. But existing owners proved reluctant to part with their homes, with supply on the market reaching a record low late in 2020. The median home price increased 36% over the last two years. More recently, persistent inflation and higher interest rates make it even harder to buy a home.
However, some parts of the U.S. are more favorable for homebuyers, with adequate supply, a high share of smaller homes, relatively low prices for starter homes, and strong homeownership rates among young people.
Construction Coverage used data from the U.S. Census Bureau, Zillow, and Redfin. To learn more, see the final slide, on methodology.
Following are the U.S. metropolitan areas where you’re most likely to find a starter home.
15. Cleveland-Elyria, OH

Composite score: 44.7
Percentage of homes with ≤ 3 bedrooms: 66.6%
Median sale price of homes with ≤ 3 bedrooms: $189,103
Months’ supply: 1.5
Homeownership rate for under-35 householders: 10.1%
14. Cincinnati, OH-KY-IN

Composite score: 45.6
Percentage of homes with ≤ 3 bedrooms: 65.6%
Median sale price of homes with ≤ 3 bedrooms: $224,694
Months’ supply: 1.8
Homeownership rate for under-35 householders: 13.3%

13. Buffalo-Cheektowaga, NY
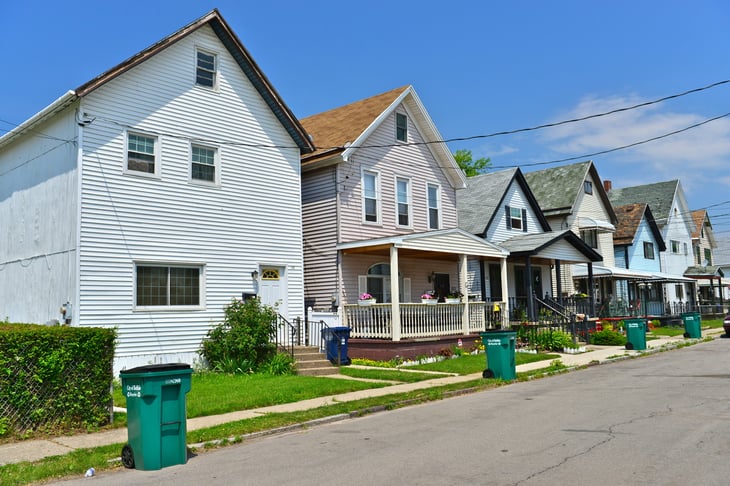
Composite score: 45.6
Percentage of homes with ≤ 3 bedrooms: 70.4%
Median sale price of homes with ≤ 3 bedrooms: $226,560
Months’ supply: 1.3
Homeownership rate for under-35 householders: 10.7%
12. St. Louis, MO-IL

Composite score: 46.3
Percentage of homes with ≤ 3 bedrooms: 69.0%
Median sale price of homes with ≤ 3 bedrooms: $217,655
Months’ supply: 1.3
Homeownership rate for under-35 householders: 11.6%
11. Chicago-Naperville-Elgin, IL-IN-WI
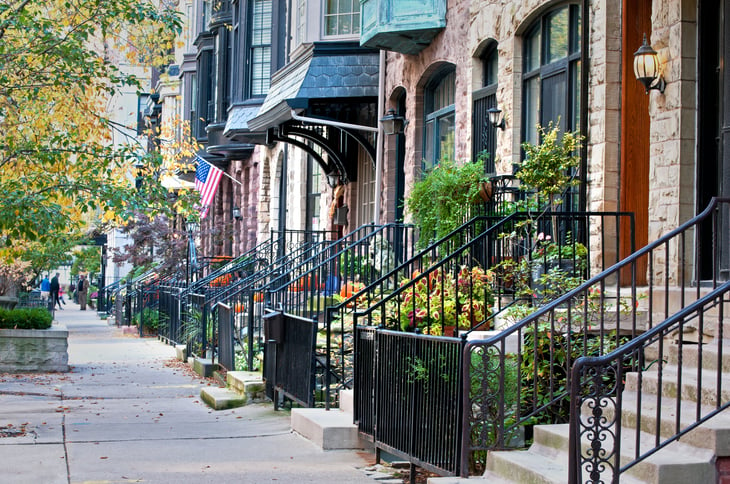
Composite score: 46.5
Percentage of homes with ≤ 3 bedrooms: 66.3%
Median sale price of homes with ≤ 3 bedrooms: $270,458
Months’ supply: 2.7
Homeownership rate for under-35 householders: 10.6%
10. Tampa-St. Petersburg-Clearwater, FL
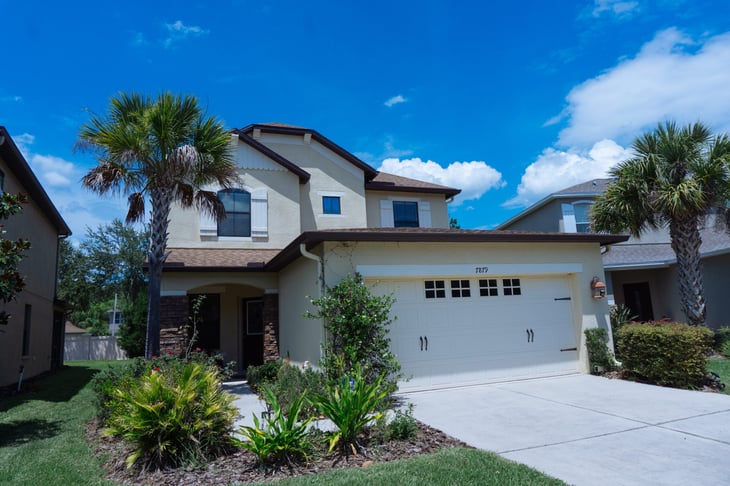
Composite score: 47.0
Percentage of homes with ≤ 3 bedrooms: 73.4%
Median sale price of homes with ≤ 3 bedrooms: $343,531
Months’ supply: 2.0
Homeownership rate for under-35 householders: 9.2%
9. Milwaukee-Waukesha, WI

Composite score: 47.8
Percentage of homes with ≤ 3 bedrooms: 70.7%
Median sale price of homes with ≤ 3 bedrooms: $251,963
Months’ supply: 1.8
Homeownership rate for under-35 householders: 10.7%
8. Louisville/Jefferson County, KY-IN

Composite score: 48.3
Percentage of homes with ≤ 3 bedrooms: 69.5%
Median sale price of homes with ≤ 3 bedrooms: $225,713
Months’ supply: 1.4
Homeownership rate for under-35 householders: 12.5%
7. Tucson, AZ
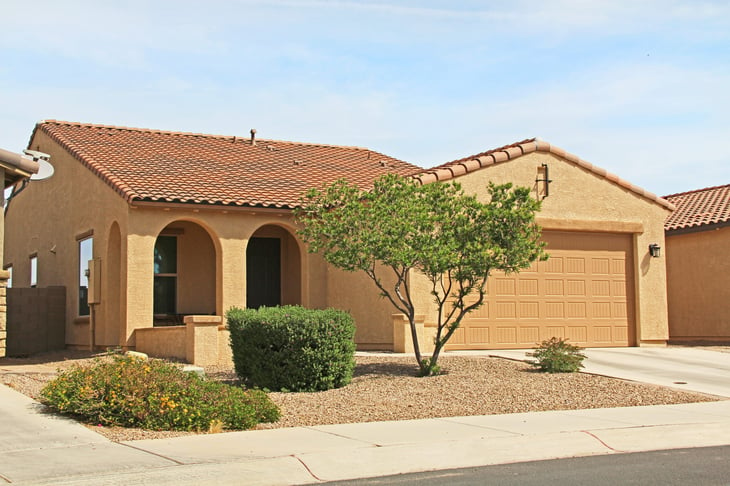
Composite score: 52.6
Percentage of homes with ≤ 3 bedrooms: 72.0%
Median sale price of homes with ≤ 3 bedrooms: $319,999
Months’ supply: 2.7
Homeownership rate for under-35 householders: 9.5%
6. Birmingham-Hoover, AL
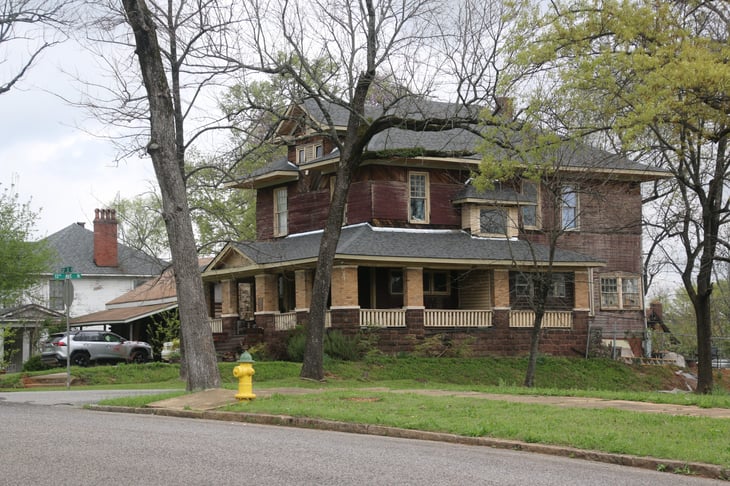
Composite score: 54.9
Percentage of homes with ≤ 3 bedrooms: 68.0%
Median sale price of homes with ≤ 3 bedrooms: $192,535
Months’ supply: 2.1
Homeownership rate for under-35 householders: 11.2%
5. New Orleans-Metairie, LA
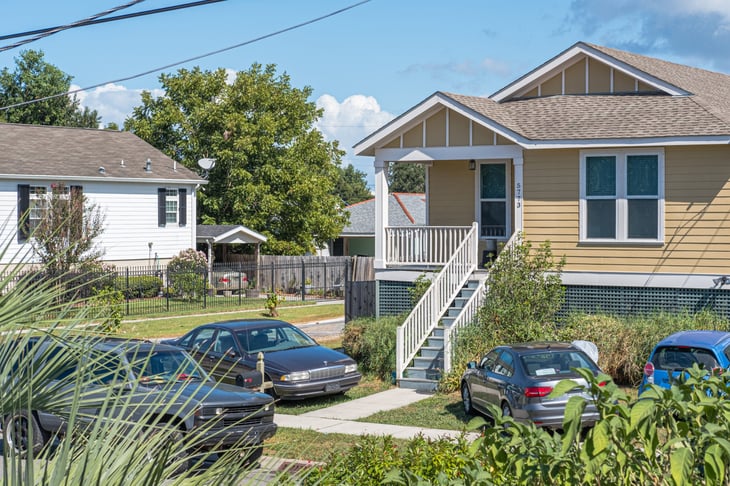
Composite score: 56.0
Percentage of homes with ≤ 3 bedrooms: 69.2%
Median sale price of homes with ≤ 3 bedrooms: $227,670
Months’ supply: 2.9
Homeownership rate for under-35 householders: 9.3%
4. Detroit-Warren-Dearborn, MI
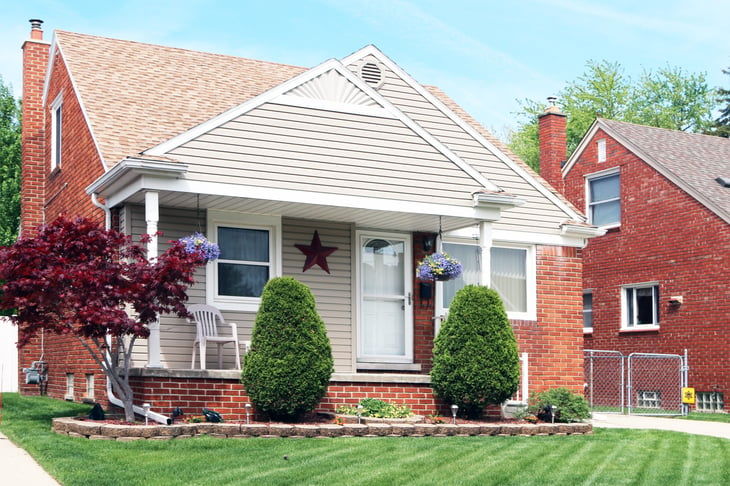
Composite score: 56.2
Percentage of homes with ≤ 3 bedrooms: 71.4%
Median sale price of homes with ≤ 3 bedrooms: $221,702
Months’ supply: 1.9
Homeownership rate for under-35 householders: 11.4%
3. Miami-Fort Lauderdale-Pompano Beach, FL

Composite score: 57.7
Percentage of homes with ≤ 3 bedrooms: 76.1%
Median sale price of homes with ≤ 3 bedrooms: $425,625
Months’ supply: 3.5
Homeownership rate for under-35 householders: 7.7%
2. Oklahoma City, OK

Composite score: 59.7
Percentage of homes with ≤ 3 bedrooms: 71.6%
Median sale price of homes with ≤ 3 bedrooms: $195,589
Months’ supply: 1.6
Homeownership rate for under-35 householders: 13.3%
1. Pittsburgh, PA

Composite score: 68.0
Percentage of homes with ≤ 3 bedrooms: 72.1%
Median sale price of homes with ≤ 3 bedrooms: $190,349
Months’ supply: 2.9
Homeownership rate for under-35 householders: 10.5%
Methodology

The data used in this analysis is from the U.S. Census Bureau’s 2021 American Community Survey, Zillow’s Housing Data, and Redfin’s Data Center.
To determine the locations where you’re most likely to find a new starter home, researchers at Construction Coverage calculated a composite score based on the percentage of homes with three or fewer bedrooms, the median sale price of homes with three or fewer bedrooms, the months of supply of houses for sale, and the homeownership rate for householders under 35 years old.
In the event of a tie, the location with the greater percentage of homes with three or fewer bedrooms was ranked higher. Only metropolitan areas with at least 100,000 residents were included.
Add a Comment
Our Policy: We welcome relevant and respectful comments in order to foster healthy and informative discussions. All other comments may be removed. Comments with links are automatically held for moderation.