


This story originally appeared on SmartAsset.com.
Though the COVID-19 crisis has resulted in widespread fitness center closures, many Americans still want to stay as healthy as possible. Depending on the level of services and equipment required, staying active can affect people’s budgets in a variety of ways. For now, virtual exercise classes and home gyms are the routes most people are taking.
Eventually, though, gyms will reopen at full capacity, and everyone will be able to re-establish his or her normal workout routine. When that happens, some places will be more conducive to jumping into a full-on fitness frenzy, and SmartAsset crunched the numbers to find where they are.
To locate the most fitness-friendly places for 2021, we compared 301 metropolitan areas across the following metrics: percentage of residents who walk or bike to work, fitness professionals per 10,000 workers, fitness establishments per 10,000 establishments, the percentage of restaurants that are fast-food establishments, and the average wage of personal trainers. For details on our data sources and how we put all the information together to create our final rankings, check out the Data and Methodology section at the end.
This is SmartAsset’s seventh annual study on the most fitness-friendly places in the U.S. Read the previous version here.
Following are the most fitness-friendly places for 2021.
1. Missoula, MT
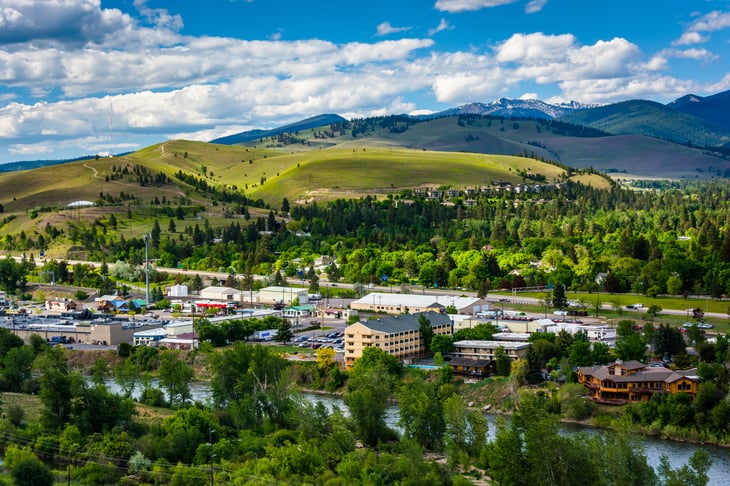
The Missoula, Montana, metro area is the most fitness-friendly place in the U.S. for 2021. There are 131 fitness establishments — including places like gyms and sporting goods stores — per 10,000 total establishments in Missoula, the third-highest rate for this metric in the study.
There are also plenty of fitness professionals living in Missoula, 59 per 10,000 workers, placing it sixth-best for this metric. Residents in Missoula also get plenty of exercise simply by walking or biking to work: 7.1% of residents choose to do so, the 17th-highest rate for this metric across the 301 areas we studied.
2. La Crosse-Onalaska, WI-MN
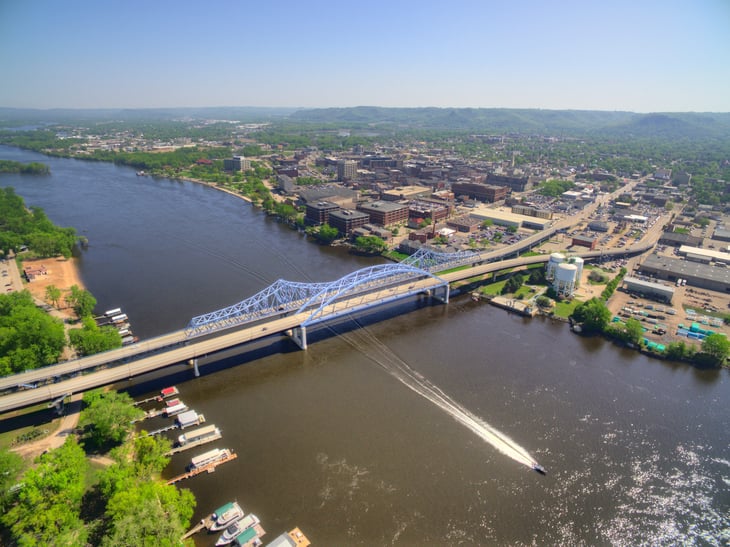
The La Crosse, Wisconsin, metro area, which also includes parts of Minnesota, has 130 fitness establishments for every 10,000 total establishments, the fourth-highest rate for this metric. The metro area finishes in the top quartile for three other metrics as well, ranking 28th for fitness professionals per 10,000 workers (with 42), 33rd for the percentage of residents who walk or bike to work (at 5.2%), and 64th for the percentage of restaurants that are fast-food establishments (around 39%).
3. Bend, OR

The Bend, Oregon, metro area cracks the top 10 for two of our metrics. It places fourth in terms of fitness professionals per 10,000 workers with 61, and seventh for fitness establishments per 10,0000 total establishments, at 116. Bend can be a bit pricey of a place to stay in shape, though. The average hourly wage of personal trainers is $18.72, placing Bend at 176th out of 301 for this metric.

4. Ann Arbor, MI
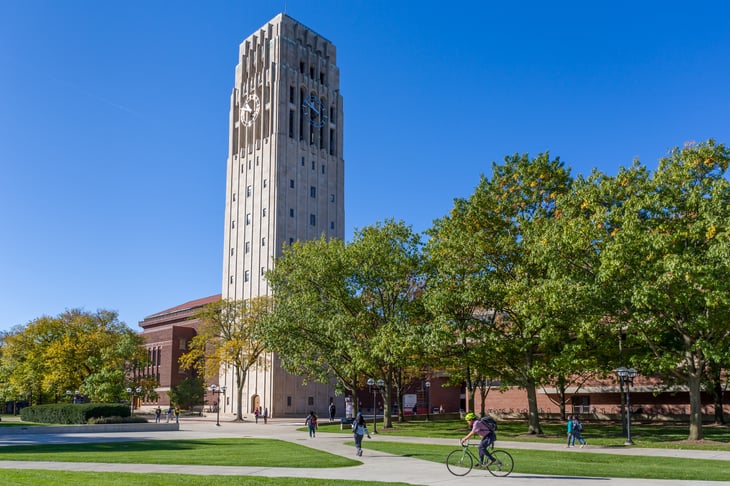
There are 67 fitness professionals per 10,000 workers in the Ann Arbor, Michigan, metro area, the second-highest rate for this metric of the 301 metro areas we analyzed. For their commutes, 7.4% of residents walk or bike to work, the 15th-highest percentage in this study. There are also plenty of fitness establishments in the metro area if you prefer to work out in a dedicated space: At 112 per 10,000 residents, this is the 10th-highest rate of the 301 places we analyzed.
5. Bloomington, IN

Folks in the Bloomington, Indiana, metro area might have more of an opportunity to get a workout in during their commute, with 8.0% of residents walking or biking to work, the eighth-highest rate in the study for this metric. Bloomington has two other metrics for which it finishes in the top fifth of the 301 metro areas of the study — fitness establishments per 10,000 total establishments (ranking 48th-highest, with 93) and average wage of personal trainers (ranking 49th-lowest, which makes it cheaper for the consumer, at $14.53).
6. Santa Cruz-Watsonville, CA

The metro area around Santa Cruz, California, finishes ninth overall for its relatively low percentage of restaurants that specialize in fast food, at 33%. Santa Cruz also comes in 12th for the percentage of residents who walk or bike to work, at 7.5%. If you’re looking for help getting in shape, though, it’ll cost you. The average wage of a personal trainer in the area is a steep $20.59, ranking in the bottom third of this study.
7. Flagstaff, AZ

Flagstaff, Arizona, has the third-highest percentage of residents who walk or bike to work that we saw in this study, at 11.5%. There are also 109 fitness establishments per 10,000 total establishments, the 14th-highest rate we observed. Flagstaff is hurt, though, by its cost: The average wage of a personal trainer in this metro area is $22.27, in the bottom sixth of this study.
8. Fort Collins, CO
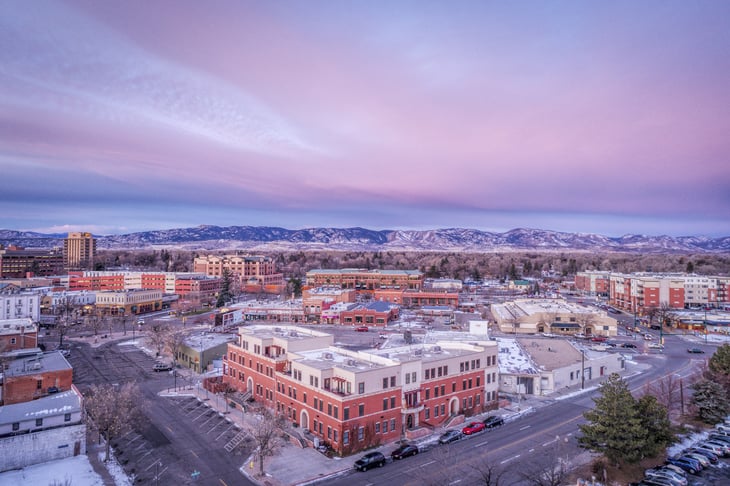
Fort Collins is the first of two metro areas in Colorado to rank in the top 10 of this study, and it gets there on the strength of having 113 fitness establishments per 10,000 total establishments, ranking ninth of 301 metro areas for this metric. It also scores in the top 15% of the study for the percentage of residents who walk or bike to work (5.2%) and fitness professionals per 10,000 workers (46).
9. Boulder, CO
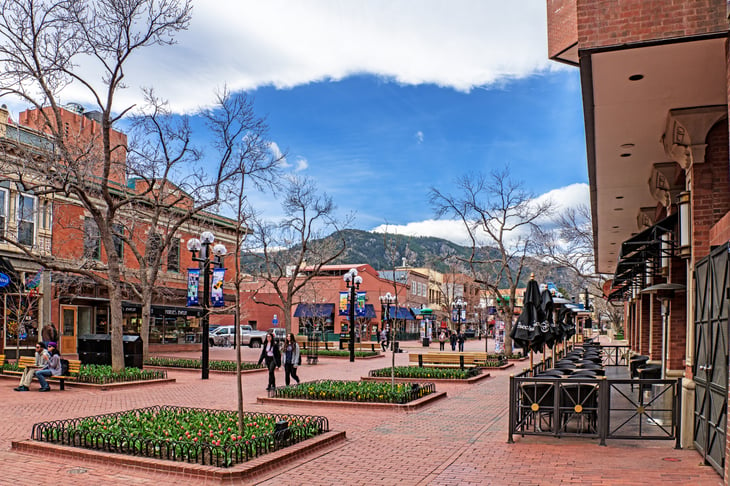
Boulder is the second Colorado metro area in the top 10, and it has two metrics for which it finishes in the top 15 out of 301 in the study overall. It comes in 11th for fitness professionals per 10,000 workers, at 53, and 12th for the percentage of residents who walk or bike to work, at 7.5%. Its final ranking is dragged down a bit due to its bottom-10 finish for the average hourly wage for personal trainers, at a pricey $27.25. However, it still ranks in the top 20 of the study for fitness establishments per 10,000 establishments, at 105.
10. Ithaca, NY

A whopping 14.5% of residents of Ithaca, New York, walk or bike to work, the second-highest percentage in this study for this metric. Ithaca finishes eighth in terms of fitness establishments per 10,000 total establishments with 114. It is very expensive to get help with fitness in Ithaca, though. The average hourly wage for a personal trainer is $29.30, finishing third-worst out of 301 metro areas in this study for its high cost.
Data and Methodology

To find the most fitness-friendly places in the country for 2021, we examined data for 301 metro areas across the following five metrics:
- Percentage of residents who walk or bike to work. Data comes from the Census Bureau’s 2019 one-year American Community Survey.
- Concentration of fitness professionals. This is the number of fitness professionals per 10,000 workers. Our list of fitness professionals includes dietitians and nutritionists, recreational therapists, athletic trainers as well as fitness trainers and aerobics instructors. Data comes from the U.S. Bureau of Labor Statistics (BLS) Occupational Employment Statistics and is for May 2019.
- Concentration of fitness establishments. This is the number of fitness establishments per 10,000 establishments. Our list of fitness establishments includes sporting goods stores and fitness and recreational sports centers. Data comes from the U.S. Census Bureau’s 2018 Metro Area Business Patterns Survey.
- Concentration of fast-food restaurants. This is the percentage of restaurants that are limited-service establishments. Data comes from the Census Bureau’s 2018 Metro Area Business Patterns Survey.
- Average hourly wage of personal trainers. Given the limited availability of direct data about the cost to consumers for personal training services, this metric acts as a proxy to indicate the relative affordability of hiring a personal trainer in a given metro area. Data comes from the BLS and is for May 2019.
First, we ranked each metro area in each metric. Then we found each place’s average ranking, giving all metrics a full weight except for concentration of fast-food restaurants and average hourly wage of personal trainers, each of which received a half weight. Using this average ranking, we created our final score. The metro area with the highest average ranking received a score of 100, and the metro area with the lowest average ranking received a score of 0.
Add a Comment
Our Policy: We welcome relevant and respectful comments in order to foster healthy and informative discussions. All other comments may be removed. Comments with links are automatically held for moderation.