


Editor's Note: This story originally appeared on Trace One.
Interest in locally grown food is picking up once again.
Farmers markets and other direct-to-consumer food outlets serve as key pillars of healthy eating and local economic support — particularly at a time when rising food costs and tariffs on imported goods have many consumers rethinking their grocery habits.
To better understand how Americans are engaging with local food, Trace One — a provider of PLM software for the food and beverage industry — conducted a national survey of U.S. adults. The survey explored shopping behaviors, attitudes toward farmers markets, and perceived benefits of buying local.
This analysis ranks the top U.S. cities for access to local food markets, measured by the number of farmers markets, on-farm markets, and community-supported agriculture (CSA) programs per 100,000 residents. Learn more about the methodology at the end.
Following are the top major cities for farmers markets.
20. Birmingham, AL

- Farm markets and community-supported agriculture (CSA) programs per 100,000 residents: 2.7
- Total farm markets and CSAs: 32
- Total population: 1,184,290
- Median household income: $69,284
19. Buffalo-Cheektowaga, NY
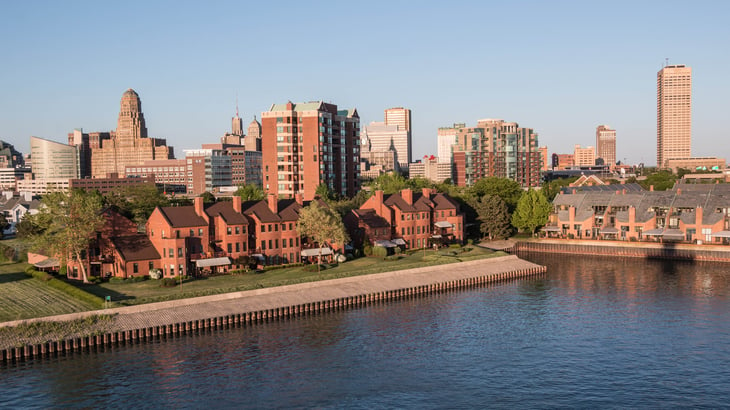
- Farm markets and community-supported agriculture (CSA) programs per 100,000 residents: 2.9
- Total farm markets and CSAs: 33
- Total population: 1,155,604
- Median household income: $69,861
18. Baltimore-Columbia-Towson, MD

- Farm markets and community-supported agriculture (CSA) programs per 100,000 residents: 2.9
- Total farm markets and CSAs: 81
- Total population: 2,834,316
- Median household income: $94,289

17. Chicago-Naperville-Elgin, IL-IN

- Farm markets and community-supported agriculture (CSA) programs per 100,000 residents: 2.9
- Total farm markets and CSAs: 266
- Total population: 9,262,559
- Median household income: $87,071
16. Virginia Beach-Chesapeake-Norfolk, VA-NC
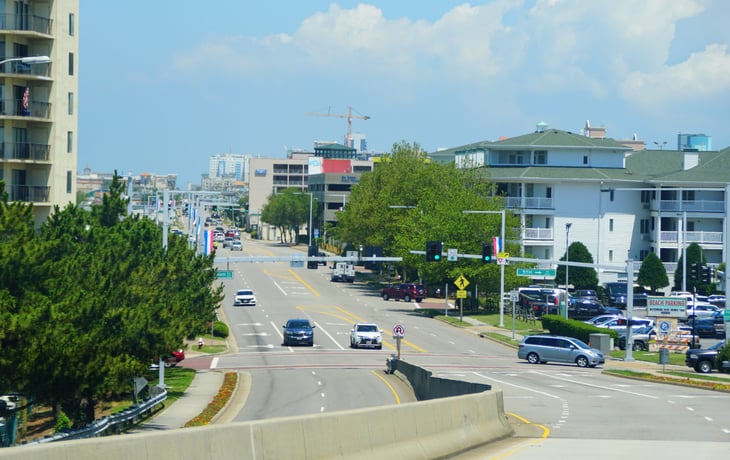
- Farm markets and community-supported agriculture (CSA) programs per 100,000 residents: 2.9
- Total farm markets and CSAs: 52
- Total population: 1,781,671
- Median household income: $79,325

15. Sacramento-Roseville-Folsom, CA
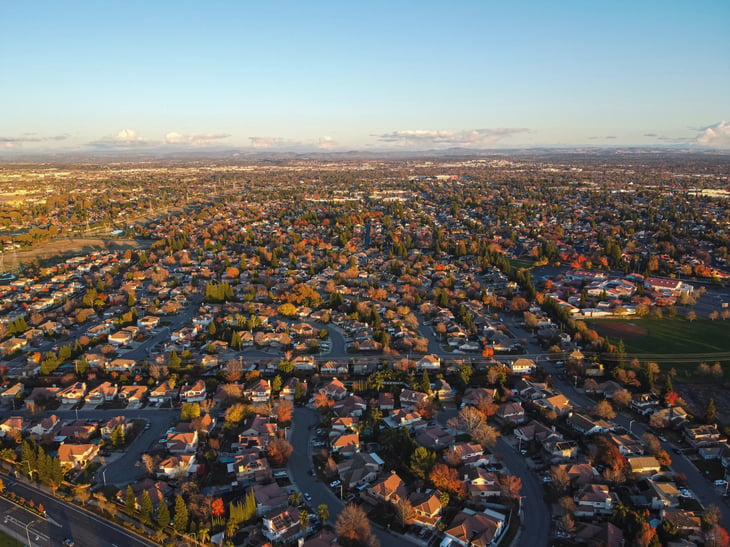
- Farm markets and community-supported agriculture (CSA) programs per 100,000 residents: 2.9
- Total farm markets and CSAs: 71
- Total population: 2,420,608
- Median household income: $94,992
14. Kansas City, MO-KS

- Farm markets and community-supported agriculture (CSA) programs per 100,000 residents: 3.0
- Total farm markets and CSAs: 66
- Total population: 2,219,865
- Median household income: $79,842

13. Pittsburgh, PA

- Farm markets and community-supported agriculture (CSA) programs per 100,000 residents: 3.1
- Total farm markets and CSAs: 74
- Total population: 2,422,725
- Median household income: $72,532
12. Indianapolis-Carmel-Greenwood, IN

- Farm markets and community-supported agriculture (CSA) programs per 100,000 residents: 3.5
- Total farm markets and CSAs: 74
- Total population: 2,139,689
- Median household income: $77,947

11. Boston-Cambridge-Newton, MA-NH

- Farm markets and community-supported agriculture (CSA) programs per 100,000 residents: 3.8
- Total farm markets and CSAs: 189
- Total population: 4,919,179
- Median household income: $110,697
10. Milwaukee-Waukesha, WI
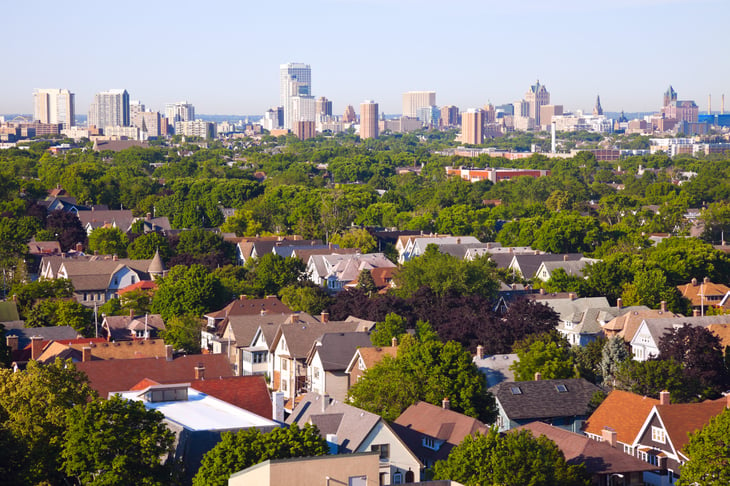
- Farm markets and community-supported agriculture (CSA) programs per 100,000 residents: 3.9
- Total farm markets and CSAs: 61
- Total population: 1,560,424
- Median household income: $77,006

9. Richmond, VA

- Farm markets and community-supported agriculture (CSA) programs per 100,000 residents: 4.3
- Total farm markets and CSAs: 58
- Total population: 1,350,123
- Median household income: $84,332
8. Louisville/Jefferson County, KY-IN

- Farm markets and community-supported agriculture (CSA) programs per 100,000 residents: 4.5
- Total farm markets and CSAs: 61
- Total population: 1,364,742
- Median household income: $68,921

7. Washington-Arlington-Alexandria, DC-VA-MD-WV

- Farm markets and community-supported agriculture (CSA) programs per 100,000 residents: 4.5
- Total farm markets and CSAs: 285
- Total population: 6,304,449
- Median household income: $121,469
6. Providence-Warwick, RI-MA

- Farm markets and community-supported agriculture (CSA) programs per 100,000 residents: 4.6
- Total farm markets and CSAs: 78
- Total population: 1,677,803
- Median household income: $83,330

5. Portland-Vancouver-Hillsboro, OR-WA

- Farm markets and community-supported agriculture (CSA) programs per 100,000 residents: 5.0
- Total farm markets and CSAs: 126
- Total population: 2,509,925
- Median household income: $94,925
4. Hartford-West Hartford-East Hartford, CT

- Farm markets and community-supported agriculture (CSA) programs per 100,000 residents: 6.0
- Total farm markets and CSAs: 69
- Total population: 1,151,543
- Median household income: $92,176

3. Rochester, NY

- Farm markets and community-supported agriculture (CSA) programs per 100,000 residents: 6.1
- Total farm markets and CSAs: 64
- Total population: 1,052,087
- Median household income: $73,294
2. Grand Rapids-Wyoming-Kentwood, MI

- Farm markets and community-supported agriculture (CSA) programs per 100,000 residents: 6.7
- Total farm markets and CSAs: 78
- Total population: 1,162,950
- Median household income: $77,979

1. Minneapolis-St. Paul-Bloomington, MN-WI

- Farm markets and community-supported agriculture (CSA) programs per 100,000 residents: 6.9
- Total farm markets and CSAs: 257
- Total population: 3,712,020
- Median household income: $95,102
Methodology

This analysis incorporates data from three primary sources: the USDA Local Food Directories, the U.S. Census Bureau’s 2023 American Community Survey (1-Year Estimates), and the Trace One April 2025 Local Food Survey, a proprietary survey of U.S. adults.
Researchers evaluated access to local food markets by calculating the number of farmers markets, on-farm markets, and community-supported agriculture (CSA) programs per 100,000 residents in each location.
In addition to tracking access, the Trace One survey captured consumer attitudes toward farmers markets and local food, including perceptions of diet, shopping and spending habits, and the perceived benefits of buying local.
To ensure comparability across regions, only metropolitan and micropolitan areas with at least 10 total markets and CSAs were included. In the event of ties, the location with the higher absolute number of local food options was ranked higher. For additional context, large metros were categorized by population size of 350,000 or more.
It is important to note that participation in the USDA directories is voluntary and self-reported by market operators. As such, some markets may not be captured; however, the dataset remains the most comprehensive centralized resource available.


Add a Comment