



Editor's Note: This story originally appeared on Construction Coverage.
The U.S. construction industry faces a high degree of uncertainty.
On one hand, demand for new housing and infrastructure remains high, driven by a persistent housing shortage and a wave of federal investment.
On the other hand, the sector is grappling with notable headwinds. Labor shortages have tightened the market for skilled workers, while overall construction spending has slowed recently amid elevated interest rates and broader economic uncertainty.
These conflicting trends have cast a spotlight on the construction workforce.
Historically, construction employment has closely mirrored macroeconomic cycles. The recent post-pandemic boom brought millions of workers back into the industry, with employment reaching over 8 million in 2024 according to Bureau of Labor Statistics data.
But as economic momentum cools, there is growing interest in where construction activity remains most concentrated.
This analysis by Construction Coverage highlights the top U.S. cities where construction workers make up the largest share of the local workforce. These high-concentration areas not only reflect where construction activity is most robust, but also where local economies may be most exposed should the sector contract.
20. Seattle-Tacoma-Bellevue, WA
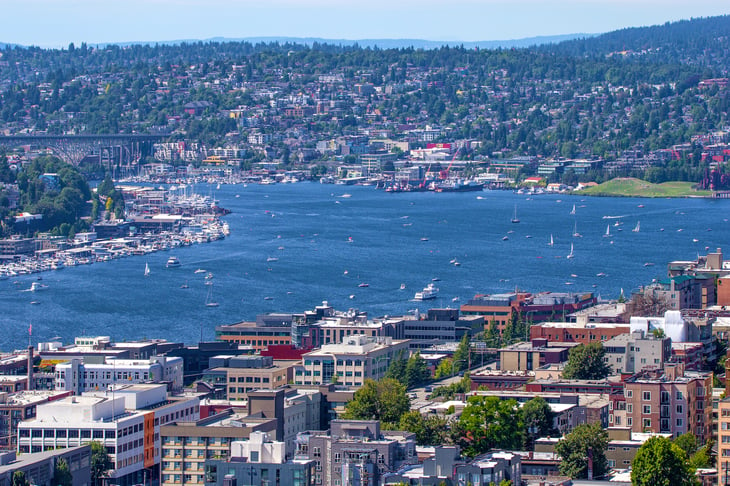
- Percentage of employment in construction: 6.7%
- Construction employment concentration (compared to average): +0.6 percentage points
- Total number of construction employees: 119,901
- Year-over-year change in construction employment: -4.1%
19. Tulsa, OK
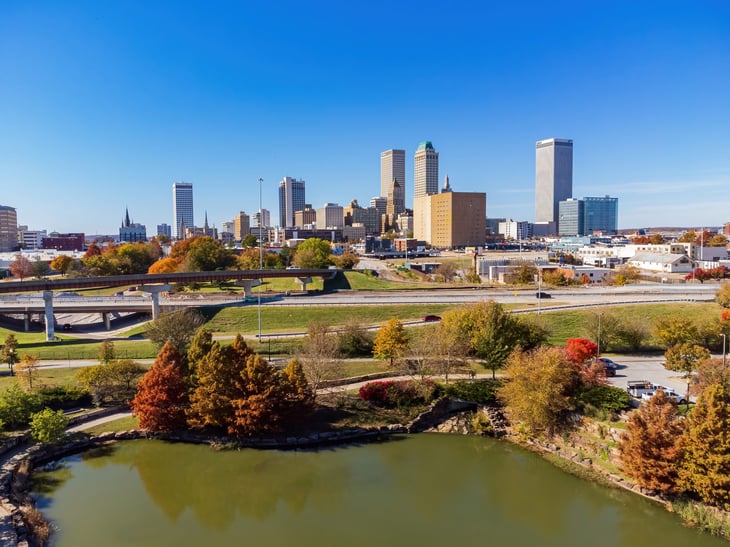
- Percentage of employment in construction: 6.9%
- Construction employment concentration (compared to average): +0.8 percentage points
- Total number of construction employees: 27,438
- Year-over-year change in construction employment: +5.7%
18. Baltimore-Columbia-Towson, MD
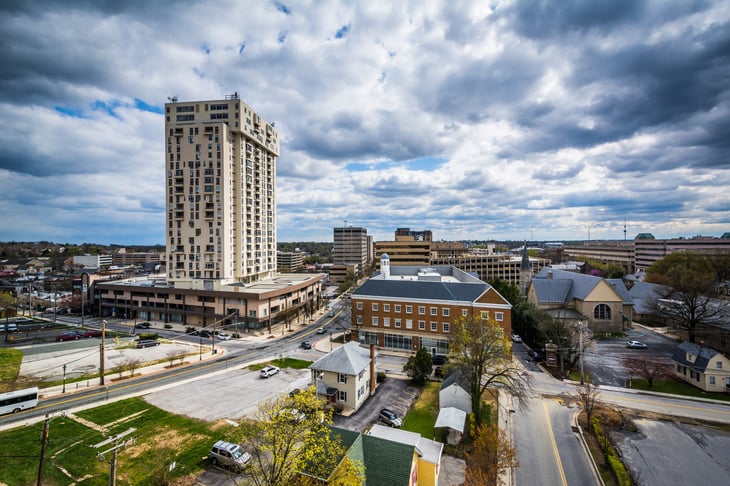
- Percentage of employment in construction: 7.0%
- Construction employment concentration (compared to average): +0.9 percentage points
- Total number of construction employees: 78,327
- Year-over-year change in construction employment: +0.2%
17. San Diego-Chula Vista-Carlsbad, CA
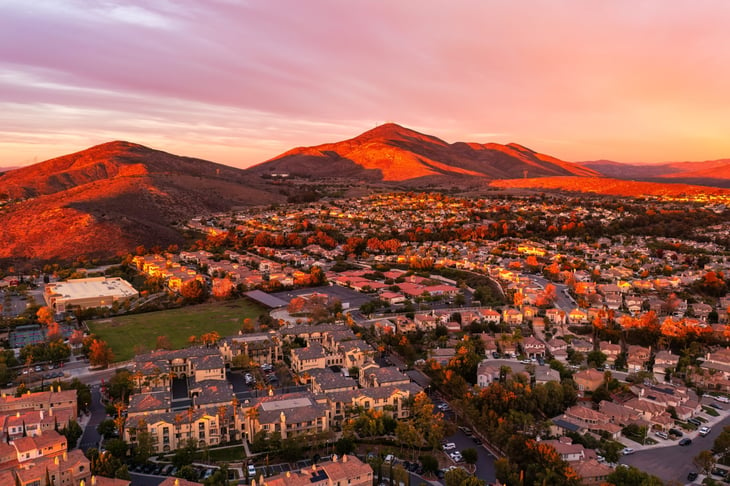
- Percentage of employment in construction: 7.0%
- Construction employment concentration (compared to average): +0.9 percentage points
- Total number of construction employees: 89,873
- Year-over-year change in construction employment: +0.6%
16. Tampa-St. Petersburg-Clearwater, FL
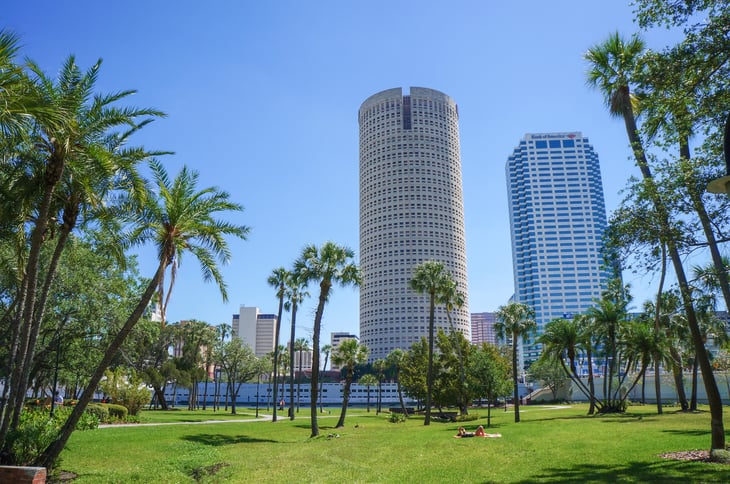
- Percentage of employment in construction: 7.1%
- Construction employment concentration (compared to average): +1.0 percentage points
- Total number of construction employees: 91,994
- Year-over-year change in construction employment: +2.0%
15. San Antonio-New Braunfels, TX

- Percentage of employment in construction: 7.2%
- Construction employment concentration (compared to average): +1.1 percentage points
- Total number of construction employees: 67,162
- Year-over-year change in construction employment: +5.4%
14. Orlando-Kissimmee-Sanford, FL

- Percentage of employment in construction: 7.2%
- Construction employment concentration (compared to average): +1.1 percentage points
- Total number of construction employees: 91,258
- Year-over-year change in construction employment: +3.4%
13. Richmond, VA
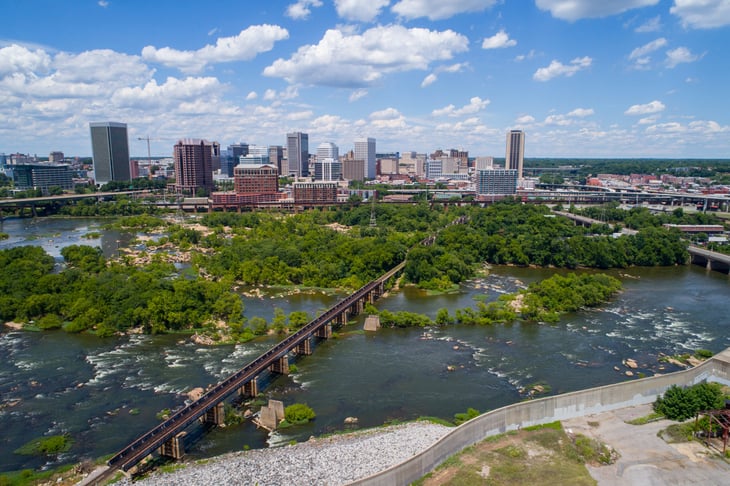
- Percentage of employment in construction: 7.4%
- Construction employment concentration (compared to average): +1.3 percentage points
- Total number of construction employees: 40,432
- Year-over-year change in construction employment: N/A
12. Portland-Vancouver-Hillsboro, OR-WA
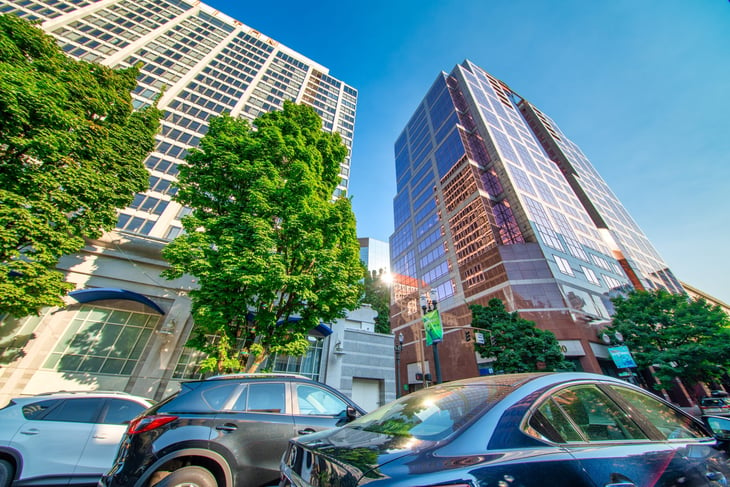
- Percentage of employment in construction: 7.5%
- Construction employment concentration (compared to average): +1.4 percentage points
- Total number of construction employees: 79,839
- Year-over-year change in construction employment: N/A
11. Omaha, NE-IA
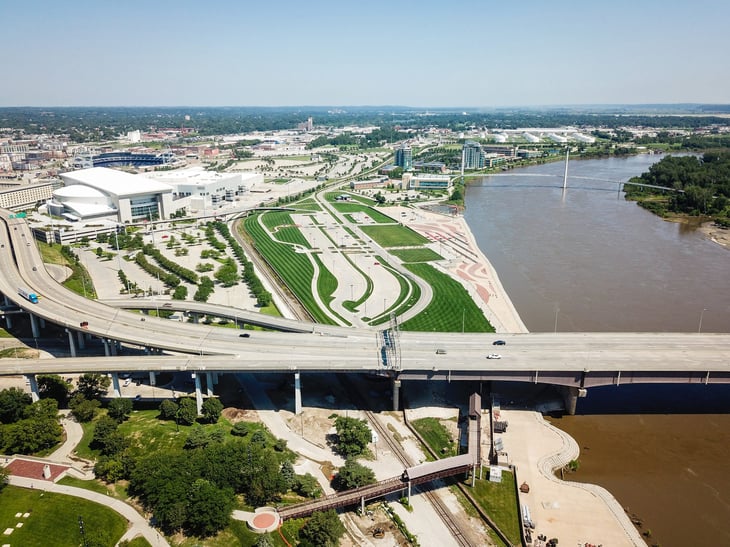
- Percentage of employment in construction: 7.6%
- Construction employment concentration (compared to average): +1.5 percentage points
- Total number of construction employees: 32,534
- Year-over-year change in construction employment: -0.2%

10. Jacksonville, FL
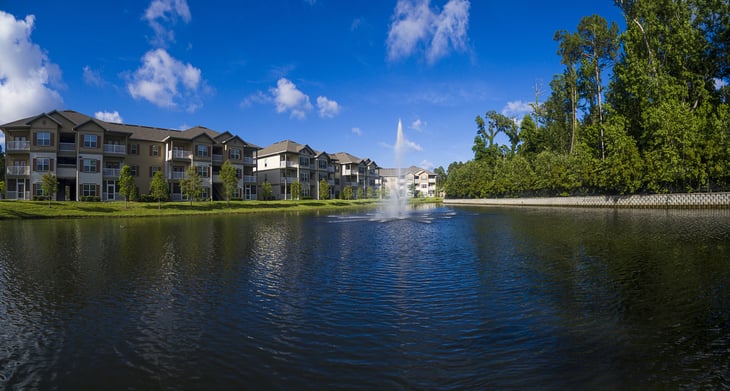
- Percentage of employment in construction: 7.6%
- Construction employment concentration (compared to average): +1.5 percentage points
- Total number of construction employees: 51,267
- Year-over-year change in construction employment: +4.3%
9. Denver-Aurora-Centennial, CO
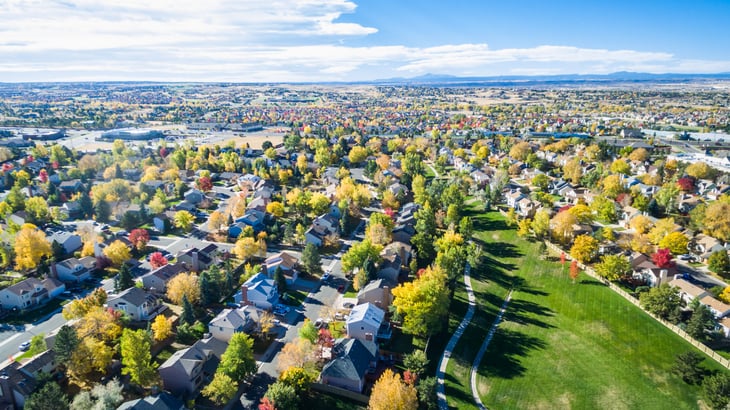
- Percentage of employment in construction: 7.6%
- Construction employment concentration (compared to average): +1.5 percentage points
- Total number of construction employees: 105,447
- Year-over-year change in construction employment: +0.1%
8. Las Vegas-Henderson-North Las Vegas, NV
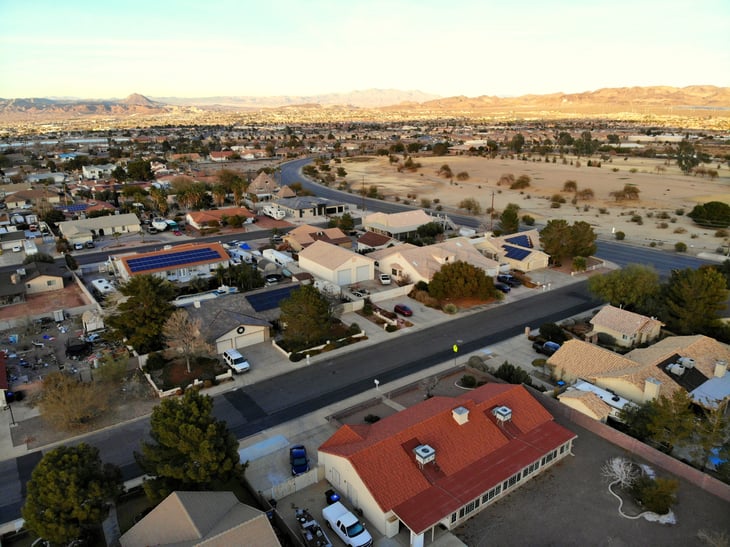
- Percentage of employment in construction: 7.7%
- Construction employment concentration (compared to average): +1.6 percentage points
- Total number of construction employees: 77,667
- Year-over-year change in construction employment: -3.0%
7. Austin-Round Rock-San Marcos, TX

- Percentage of employment in construction: 7.7%
- Construction employment concentration (compared to average): +1.6 percentage points
- Total number of construction employees: 82,969
- Year-over-year change in construction employment: +6.4%
6. Salt Lake City-Murray, UT

- Percentage of employment in construction: 8.0%
- Construction employment concentration (compared to average): +1.9 percentage points
- Total number of construction employees: 56,160
- Year-over-year change in construction employment: +1.8%
5. Houston-Pasadena-The Woodlands, TX
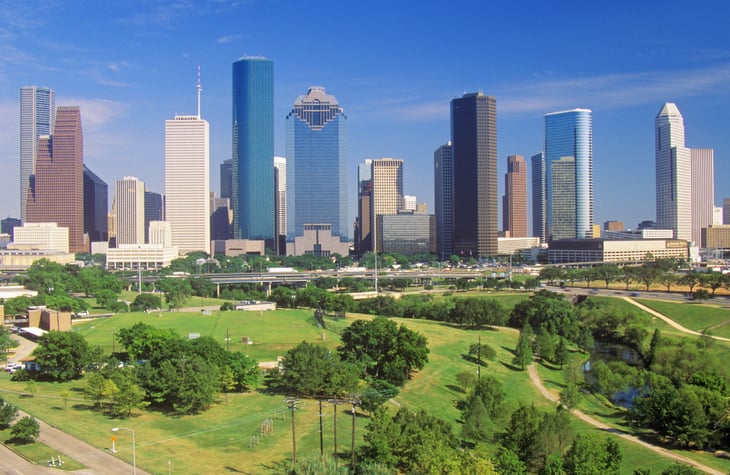
- Percentage of employment in construction: 8.1%
- Construction employment concentration (compared to average): +2.0 percentage points
- Total number of construction employees: 227,943
- Year-over-year change in construction employment: +0.6%
4. Riverside-San Bernardino-Ontario, CA
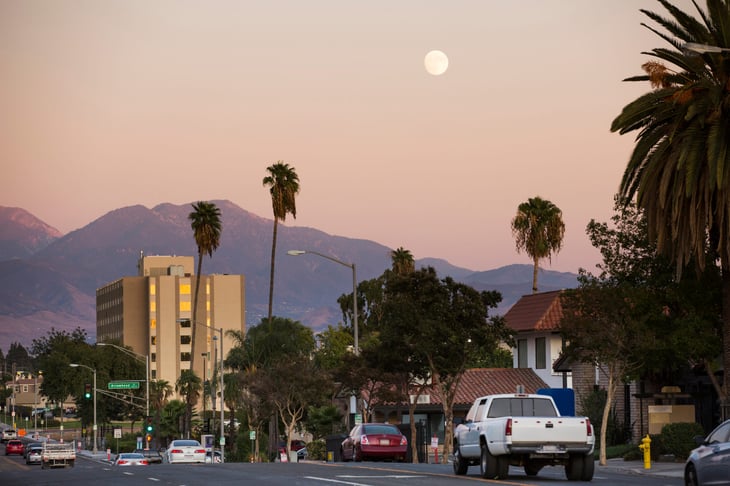
- Percentage of employment in construction: 8.2%
- Construction employment concentration (compared to average): +2.1 percentage points
- Total number of construction employees: 115,175
- Year-over-year change in construction employment: +0.5%
3. Raleigh-Cary, NC
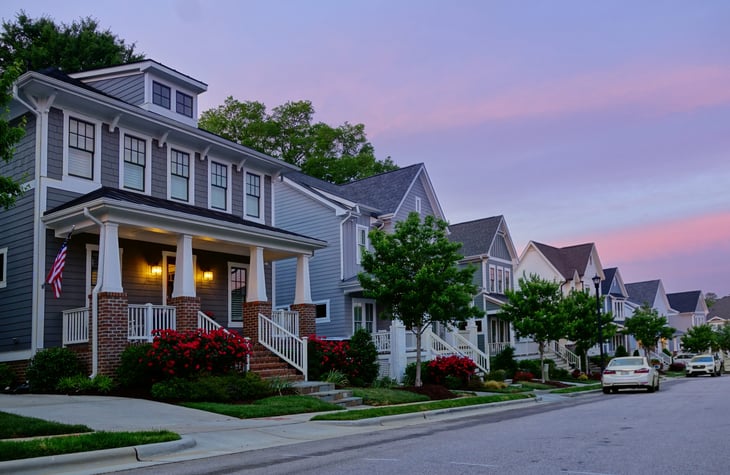
- Percentage of employment in construction: 8.4%
- Construction employment concentration (compared to average): +2.3 percentage points
- Total number of construction employees: 52,884
- Year-over-year change in construction employment: +5.5%
2. Phoenix-Mesa-Chandler, AZ
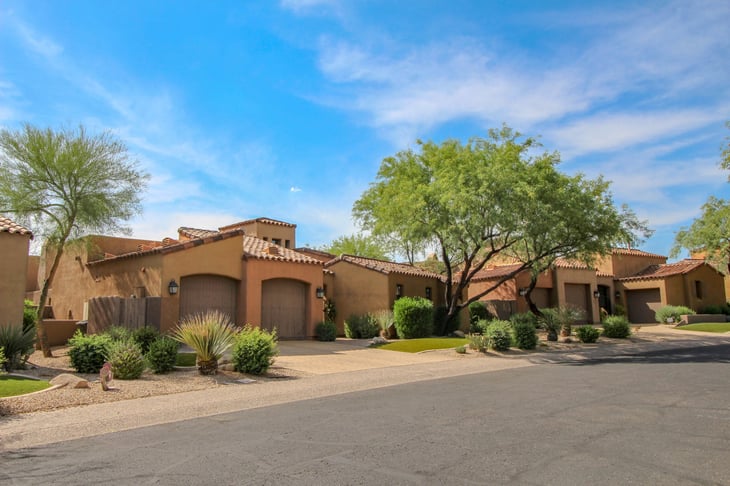
- Percentage of employment in construction: 8.4%
- Construction employment concentration (compared to average): +2.3 percentage points
- Total number of construction employees: 178,819
- Year-over-year change in construction employment: +6.9%
1. Sacramento-Roseville-Folsom, CA
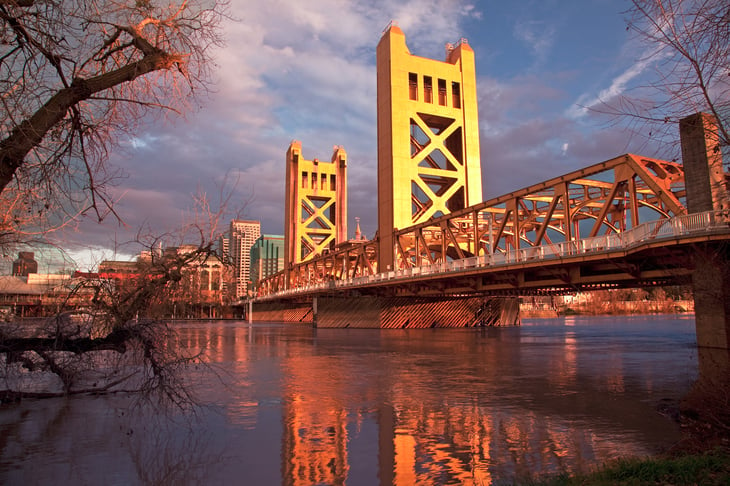
- Percentage of employment in construction: 9.3%
- Construction employment concentration (compared to average): +3.2 percentage points
- Total number of construction employees: 76,110
- Year-over-year change in construction employment: +2.8%
Methodology

To determine the locations with the most construction workers, researchers at Construction Coverage analyzed the latest data from the U.S. Bureau of Labor Statistics’ Quarterly Census of Employment and Wages.
The researchers ranked locations by the percentage of total employment in the construction industry in 2024, the latest data available. In the event of a tie, the location with the greater total number of construction industry employees was ranked higher.
To improve relevance, only metropolitan areas with complete data were included.

Add a Comment