
This story originally appeared on Commodity.com.
The United States has seen its energy production transformed over the last two decades. Both natural gas and renewable energy sources have grown substantially. This has led the country to export more energy than it imports for the first time in many decades.
In 2019, the United States was a net exporter of energy for the first time since 1952. With a sharp increase over the past 20 years, production has begun to catch up with consumption and exports with imports. The nation’s net imports of coal and coke, natural gas, and petroleum have all fallen below zero, leaving only crude oil as a major fuel import — and even imports in that category are declining.
Within the U.S., states have different levels of production and consumption affecting their import and export levels as well. While some states — especially those that produce coal in large numbers — have suffered in the transition between fuels, others have dramatically increased their energy production. As a result, these states are now producing far more energy on a per capita basis than peer states are.
To find these locations, researchers at Commodity.com used data from the U.S. Energy Information Administration’s Electric Power Annual Report and ranked states based on their net energy exports per capita — calculated as the difference between per capita production and consumption.
Here are the states that export the most energy.
10. Texas

- Net energy exports per capita (million Btu): 206.2
- Total energy production per capita (million Btu): 704.3
- Total energy consumption per capita (million Btu): 498.1
- Net energy exports (trillion Btu): 5,978.2
- Total energy production (trillion Btu): 20,421.0
- Total energy consumption (trillion Btu): 14,442.8
9. Colorado

- Net energy exports per capita (million Btu): 370.0
- Total energy production per capita (million Btu): 635.9
- Total energy consumption per capita (million Btu): 265.9
- Net energy exports (trillion Btu): 2,130.8
- Total energy production (trillion Btu): 3,662.0
- Total energy consumption (trillion Btu): 1,531.2
8. Pennsylvania

- Net energy exports per capita (million Btu): 392.5
- Total energy production per capita (million Btu): 702.0
- Total energy consumption per capita (million Btu): 309.5
- Net energy exports (trillion Btu): 5,024.8
- Total energy production (trillion Btu): 8,987.0
- Total energy consumption (trillion Btu): 3,962.2
7. Montana
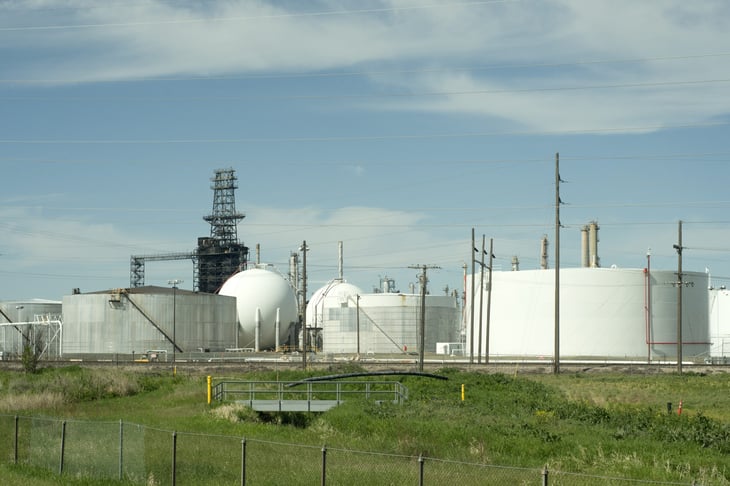
- Net energy exports per capita (million Btu): 522.5
- Total energy production per capita (million Btu): 932.8
- Total energy consumption per capita (million Btu): 410.3
- Net energy exports (trillion Btu): 558.5
- Total energy production (trillion Btu): 997.0
- Total energy consumption (trillion Btu): 438.5
6. Oklahoma
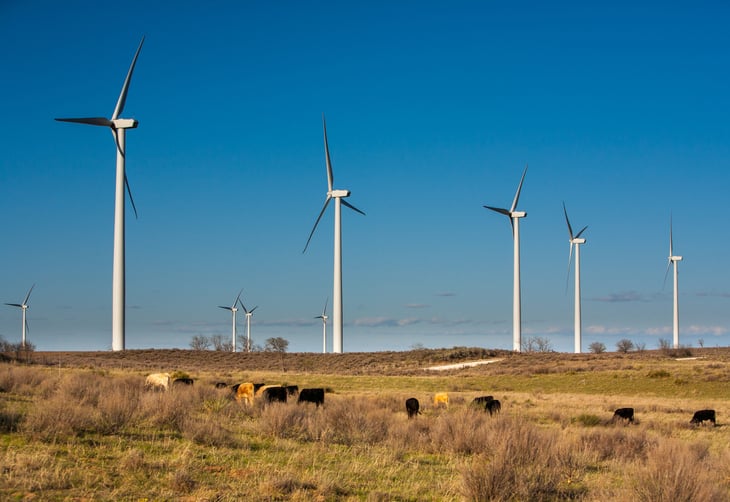
- Net energy exports per capita (million Btu): 800.4
- Total energy production per capita (million Btu): 1,233.5
- Total energy consumption per capita (million Btu): 433.1
- Net energy exports (trillion Btu): 3,167.2
- Total energy production (trillion Btu): 4,881.0
- Total energy consumption (trillion Btu): 1,713.8
5. Alaska
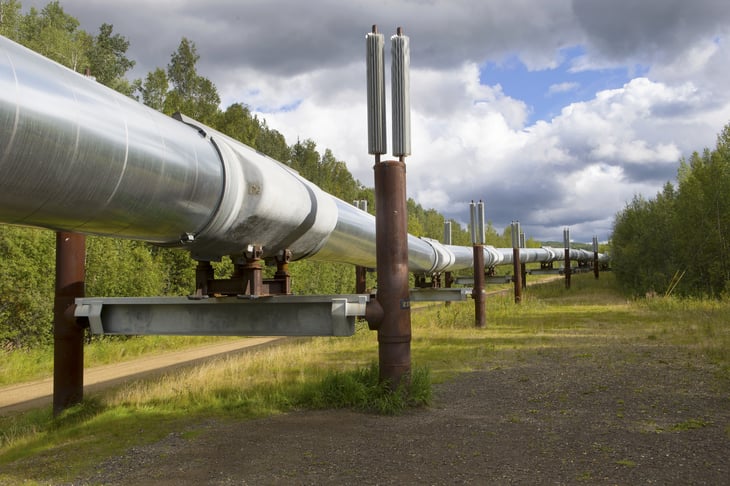
- Net energy exports per capita (million Btu): 1,099.3
- Total energy production per capita (million Btu): 1,928.8
- Total energy consumption per capita (million Btu): 829.5
- Net energy exports (trillion Btu): 804.2
- Total energy production (trillion Btu): 1,411.0
- Total energy consumption (trillion Btu): 606.8
4. New Mexico

- Net energy exports per capita (million Btu): 1,301.0
- Total energy production per capita (million Btu): 1,636.8
- Total energy consumption per capita (million Btu): 335.8
- Net energy exports (trillion Btu): 2,727.9
- Total energy production (trillion Btu): 3,432.0
- Total energy consumption (trillion Btu): 704.1
3. West Virginia

- Net energy exports per capita (million Btu): 2,200.0
- Total energy production per capita (million Btu): 2,661.6
- Total energy consumption per capita (million Btu): 461.6
- Net energy exports (trillion Btu): 3,942.7
- Total energy production (trillion Btu): 4,770.0
- Total energy consumption (trillion Btu): 827.3
2. North Dakota

- Net energy exports per capita (million Btu): 4,677.5
- Total energy production per capita (million Btu): 5,549.4
- Total energy consumption per capita (million Btu): 871.9
- Net energy exports (trillion Btu): 3,564.6
- Total energy production (trillion Btu): 4,229.0
- Total energy consumption (trillion Btu): 664.4
1. Wyoming

- Net energy exports per capita (million Btu): 12,368.3
- Total energy production per capita (million Btu): 13,335.4
- Total energy consumption per capita (million Btu): 967.1
- Net energy exports (trillion Btu): 7,158.3
- Total energy production (trillion Btu): 7,718.0
- Total energy consumption (trillion Btu): 559.7
Detailed Findings & Methodology

The data used in this analysis is from the U.S. Energy Information Administration’s Electric Power Annual Report. For the state-level analysis, researchers utilized the most recent data available, which was from the year 2018. For the national level, researchers utilized the most recent data available, which was from the year 2019. To determine the states that export the most energy, researchers ranked states based on their net energy exports per capita—the difference between per capita production and consumption. In the event of a tie, the state with the greater total energy production per capita was ranked higher.


Add a Comment
Our Policy: We welcome relevant and respectful comments in order to foster healthy and informative discussions. All other comments may be removed. Comments with links are automatically held for moderation.