


Editor's Note: This story originally appeared on SmartAsset.com.
Hispanics and Latinos make up almost 19% of the U.S. population (or 62.1 million out of more than 332 million), according to the 2020 Census.
And, according to data from the National Association of Hispanic Real Estate Professionals, they are becoming an increasingly important economic force, with almost 9 million Hispanic homeowners nationwide, after growing by more than 700,000 homeowner households in 2020.
Furthermore, the Urban Institute says that the net growth of homeowners between 2020 and 2040 will be driven by people of color, and Hispanics are poised to take the lead with an expected growth of 4.8 million.
Keeping this projected growth in mind, SmartAsset examined data to determine the cities where Hispanics and Latinos fare best economically nationwide. We compared 120 cities across five metrics, including median Hispanic household income,
Hispanic homeownership rate, poverty rate for Hispanic adults, percentage of Hispanic adults with a bachelor’s degree and the percentage of business owners who are Hispanic. For details on our data sources and how we put all the information together to create our final rankings, read the Data and Methodology section below.
This is SmartAsset’s first study on where Hispanics and Latinos fare best economically. As part of our ongoing diversity coverage, you can also read our studies on where Black Americans and Asian Americans fare best economically.
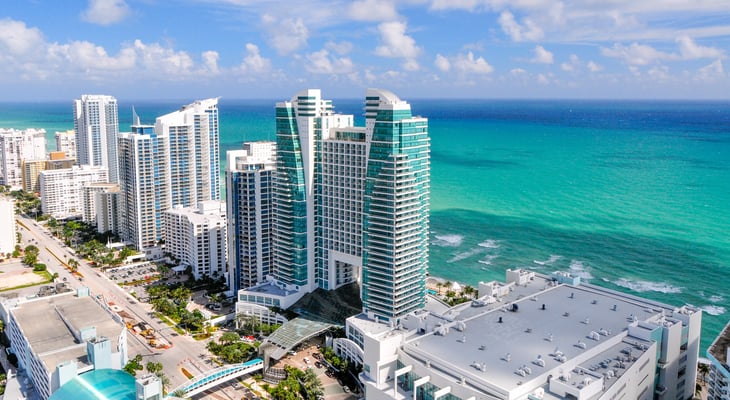
1. Miramar, FL
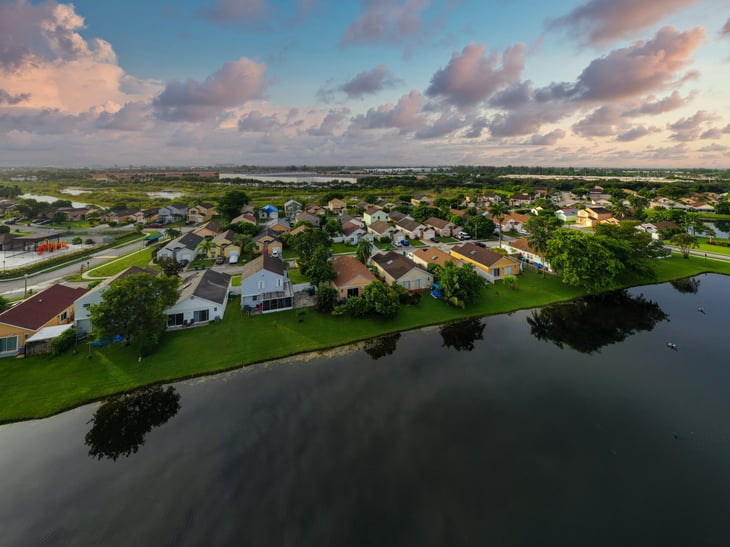
Miramar, which means “look at the sea” in Spanish, is a bedroom community for the cities of Miami and Fort Lauderdale.
This Florida city has the seventh-highest median income for Hispanics and Latinos ($90,684) and the highest homeownership rate for that group in our study. Hispanics and Latinos in the surrounding metro area own 27.01% of businesses in the city (tied for fifth-highest).
Comparatively, our study shows that business ownership for this group is only higher in four Texas cities: Laredo (56.52%), McAllen (50.21%), El Paso (43.03%) and Brownsville (41.83%).
2. Pembroke Pines, FL
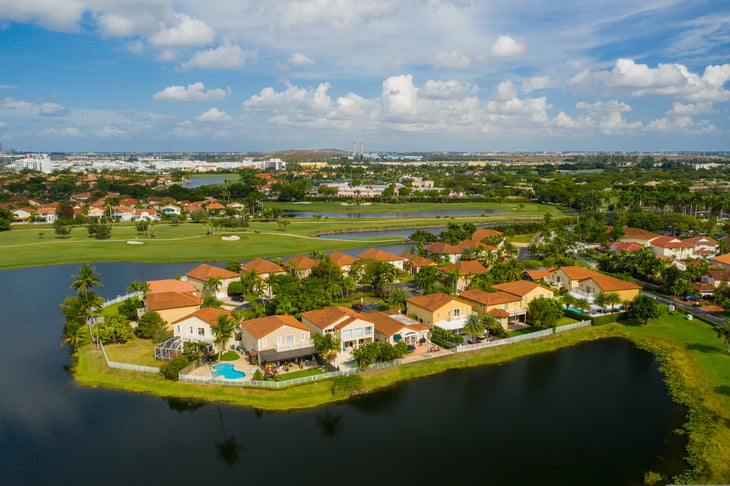
Pembroke Pines, Florida, is located about 22 miles north of Miami and has the 23rd-highest median income for Hispanics and Latinos in the study ($70,283).
In addition, this demographic group ranks 11th-highest for homeownership rate (62.30%). With the percentage of Hispanic and Latino business owners calculated on the metro level, Pembroke Pines ties its Miami metro area neighbor, Miramar, for first in this metric at 27.01%.

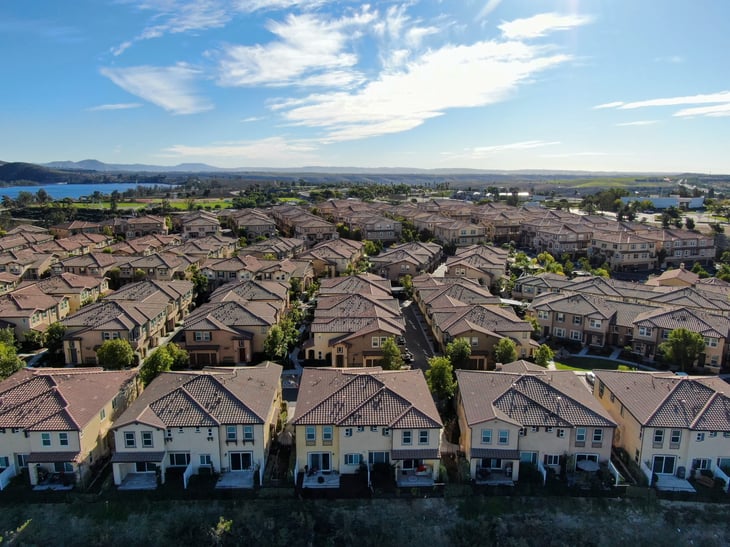
3. Rancho Cucamonga, CA
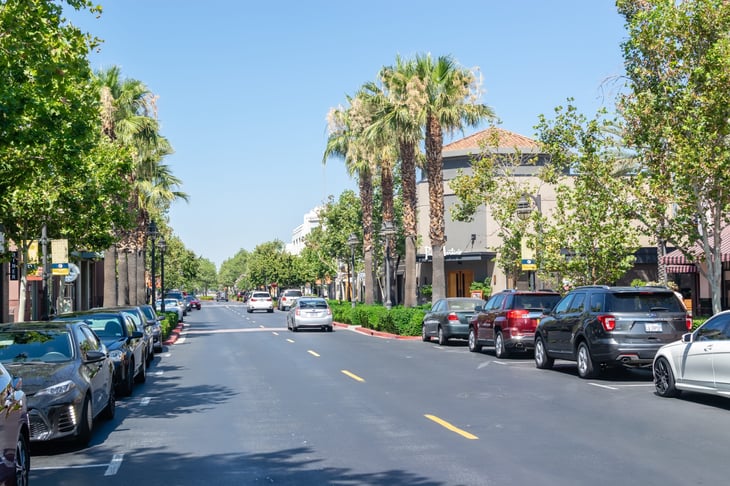
Located about 40 miles east of downtown Los Angeles, Rancho Cucamonga is the 27th-most populous city in California.
Hispanics and Latinos here have the eighth-highest median income ($87,774) and the 30th-highest homeownership rate (54.16%). In addition, Rancho Cucamonga’s surrounding Los Angeles metro area has the 14th-highest percentage of Hispanic and Latino business owners (15.59%).
4. Gilbert, AZ
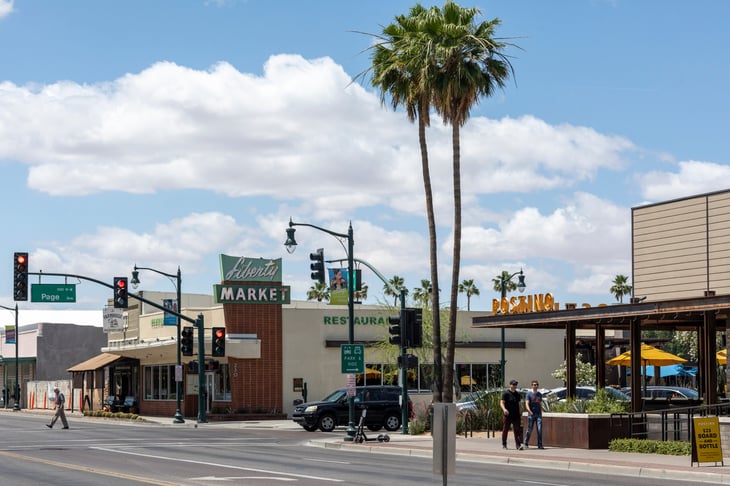
Gilbert, Arizona, is the fifth-largest municipality in the Phoenix metro area, and Hispanics and Latinos here have the highest median household income in our study, at $105,154.
In addition, they have the ninth-highest homeownership rate, at 63.66%. But only 6.10% of businesses in the Phoenix metro area are owned by this demographic group, knocking Gilbert to 64th out of 120 for this metric.
5. Naperville, IL

Located 28 miles west of Chicago, Naperville is one of the top five most populous cities in Illinois. Latinos or Hispanics here have the fourth-highest median household income ($97,956), and this group ranks toward the middle of the study (53rd place) in terms of homeownership rate (45.86%).
The Chicago metro area ranks 50th-highest overall for percentage of Hispanic and Latino business owners (6.18%).
6. Washington, D.C. (tie)

Hispanics and Latinos in the nation’s capital have the third-highest median household income ($99,799), but this demographic group falls to 75th place in the study for homeownership percentage (39.42%).
Hispanics and Latinos here have the third-highest percentage of adults with bachelor’s degrees (52.0%). The D.C. metro area ranks 48th out of 120 for its relatively small percentage of Hispanic and Latino business owners (6.23%).
6. Hollywood, FL (tie)
Located between Fort Lauderdale and Miami, Hollywood is the third Florida city in our top 10. Hispanics and Latinos here rank behind 60 other cities in the study for median household income ($54,523), but rank 38th-highest for their 50.84% homeownership rate.
Also part of the Miami metro area, Hollywood ties with Miramar and Pembroke Pines for its metro area’s fifth-highest percentage of Hispanic and Latino business owners (27.01%).
8. Peoria, AZ

Peoria, a major suburb of Phoenix, ranks as one of the 10 biggest cities in the state of Arizona by both land area and population.
Hispanics and Latinos here have the 11th-highest median household income ($78,671) and the eighth-highest homeownership rate (64.57%).
Because Peoria is also part of the Phoenix metro area, it ties Gilbert for the 64th-highest percentage of Hispanic and Latino business owners (6.10%).
9. Chula Vista, CA
Chula Vista is the second-largest city in the San Diego metro area and the 15th-largest in California. Hispanics and Latinos here have the 14th-highest household median income ($76,608) and 33rd-highest homeownership rate (53.67%) – both within the top third of the study.
In the San Diego metro area, Hispanics and Latinos make up 9.38% of business owners, 28th-highest out of all 120 cities we looked at.
10. Oceanside, CA

Oceanside is the third-largest city in San Diego County and the third California city in our top 10. Given that it is also a part of the San Diego metro area, Oceanside ties with Chula Vista in 28th place for the percentage of Hispanic and Latino business owners (9.38%).
In the city itself, this demographic group has the 16th-highest median household income ($75,631) and 25th-highest homeownership rate (56.05%).
Data and Methodology

To find the cities where Hispanics and Latinos fare best economically, SmartAsset looked at the 200 largest cities in the U.S.
Only 120 of those cities had complete data available, and we compared them across five metrics:
- Median Hispanic household income. Data comes from the Census Bureau’s 2019 1-year American Community Survey.
- Hispanic homeownership rate. This is the number of Hispanic owner-occupied housing units divided by the number of Hispanic occupied housing units. Data comes from the Census Bureau’s 2019 1-year American Community Survey.
- Poverty rate for Hispanic adults. Data comes from the Census Bureau’s 2019 1-year American Community Survey.
- Percentage of Hispanic adults with a bachelor’s degree. This is for the Hispanic population 25 years and older. Data comes from the Census Bureau’s 2019 1-year American Community Survey.
- Percentage of business owners who are Hispanic. This is the number of Hispanic-owned businesses with paid employees divided by the number of businesses with paid employees. Data comes from the Census Bureau’s 2018 Annual Business Survey and is at the metro area level.
To determine our final list, we ranked each city in every metric, giving a full weighting to all metrics. We then found each city’s average ranking and used the average to determine a final score. The city with the highest average ranking received a score of 100. The city with the lowest average ranking received a score of 0.
Editors’ Note: SmartAsset published this study in celebration and recognition of Hispanic and Latino Heritage Month. Protests for racial justice and the outsized impact of COVID-19 on people of color have highlighted the social and economic injustice that many Americans continue to face. We are aiming to raise awareness surrounding economic inequities and provide personal finance resources and information to all individuals.
Add a Comment
Our Policy: We welcome relevant and respectful comments in order to foster healthy and informative discussions. All other comments may be removed. Comments with links are automatically held for moderation.