


This story originally appeared on SmartAsset.com.
How far you live from work, school and other places you frequent can cost you time, money and health. The U.S. Census Bureau says that the average commute takes Americans 27.6 minutes each way. That’s more than 240 hours annually if you commute twice every workday in 2021. Nowadays many people have cut back their commutes entirely by working from home during the COVID-19 pandemic. If that hasn’t happened to you, you might be thinking about how to save money by carpooling or biking, or you might consider moving to shorten your commuter distance. In either case, SmartAsset examined the largest cities in America to uncover the worst commutes in 2021. Find out how your commute measures up against them.
We compared data from the 100 largest U.S. cities and ranked the worst commutes by six key metrics: commuters as a percentage of workers, average travel time to work, five-year change in average travel time, percentage of workers with a commute of more than 60 minutes, five-year change in percentage of workers with a commute of over 60 minutes, and transportation as a percentage of income. For details on our data sources and how we put all the information together to create our final rankings, check out the Data and Methodology section at the end.
This is SmartAsset’s second study on the worst commutes in America. Check out the 2020 version here.
1. Riverside, CA
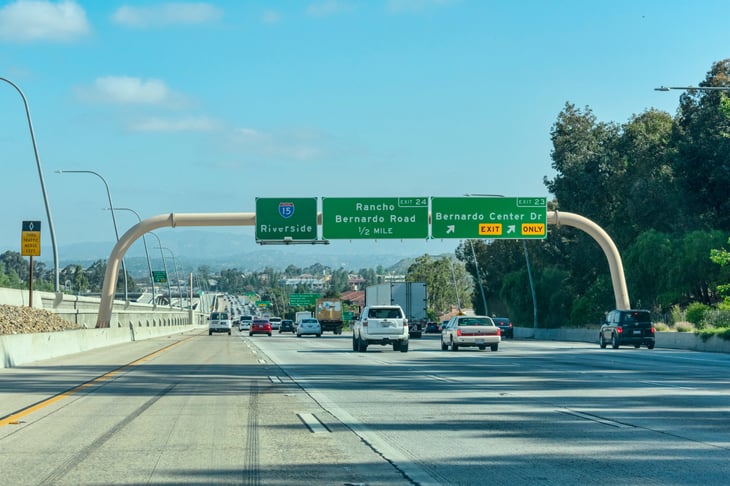
Ranked as the worst commuting city in America, Riverside, California, takes the greatest toll on its workers in transit, with 18.6% of them averaging more than 60 minutes on a trip to work. And data shows that commutes are getting longer, with a 3.7% five-year increase (2014 to 2019) in workers traveling for more than one hour. Riverside commutes average 33.9 minutes each way, and this travel time has also increased 13.38% over the same five years.
2. Stockton, CA
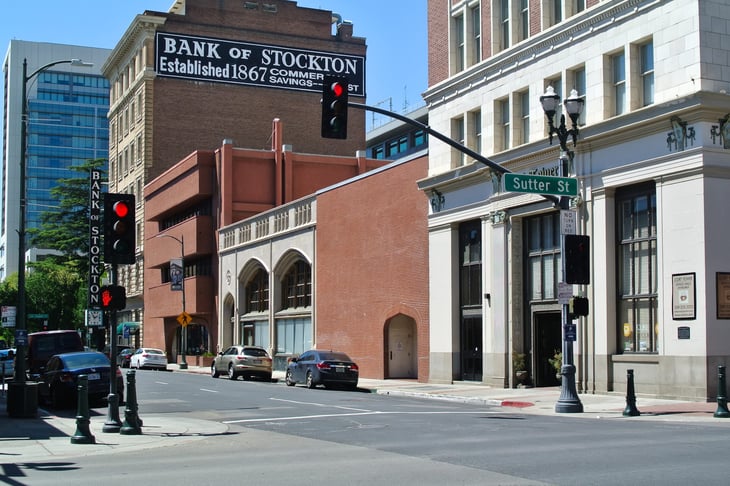
Ranking second-worst, Stockton, California, saw an increase of 18.68% in average travel time over the five-year period from 2014 to 2019. Data shows that 17.8% of workers in this Central Valley city average more than 60 minutes on their commute to work, the fifth-highest percentage for this metric across all 100 cities we studied. The average travel time for residents there is 32.4%, ranking 11th overall.
3. Hialeah, FL
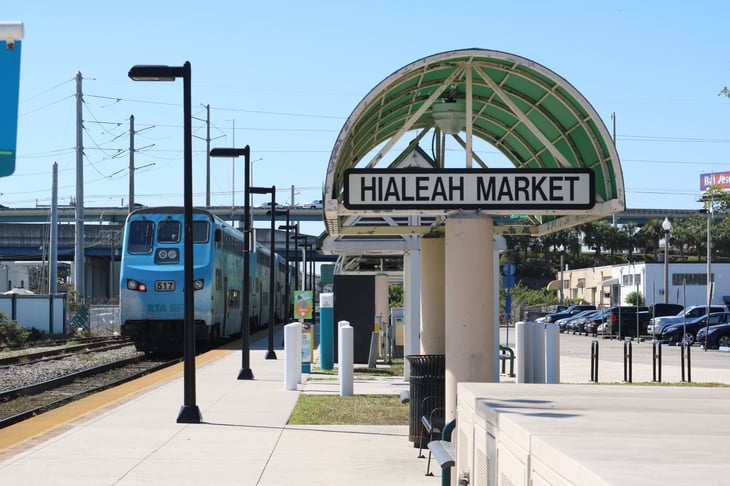
Commute times in Hialeah, Florida, a Miami suburb, have spiked more than any other city in the study — with a 26.81% jump between 2014 and 2019. Hialeah has also seen the biggest 2014-19 percentage increase for workers commuting longer than 60 minutes, a 6.1% uptick.
4. Glendale, AZ
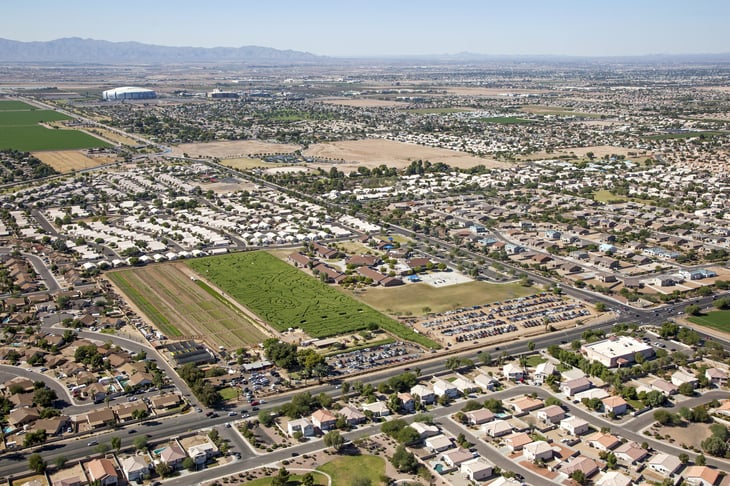
Between 2014 and 2019, the number of workers in Glendale, Arizona, with commutes longer than an hour increased 5.6%. This is the second-highest uptick for this metric overall. The percentage of workers with a commute longer than 60 minutes is 12.1%, ranking 16th-highest out of 100. Data shows that with 94.9% of Glendale workers commuting, they average 31.5 minutes on each trip.
5. Los Angeles, CA
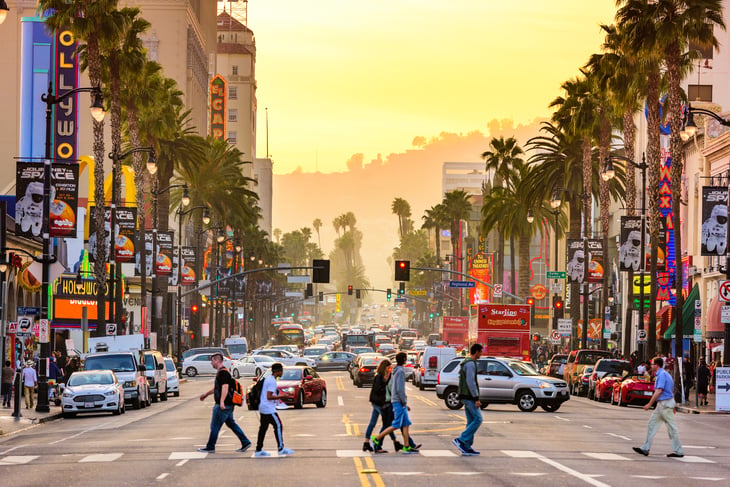
Los Angeles, California, has seen a five-year (2014 to 2019) increase of 3.3% in workers commuting longer than 60 minutes, the ninth-biggest jump for this metric in the study. With 93.5% of the workforce commuting, 15.4% of Angeleno workers need more than one hour each way to their jobs, the 11th-highest percentage for this metric overall. That said, they only spend 7.91% of their income on commuting, ranking 77th out of 100 for this metric.

6. Oakland, CA
Workers in Oakland, California, average 34.4 minutes on each trip to work, the seventh-longest travel time in the study. Oakland also ranks seventh-highest for the percentage of workers with trips longer than 60 minutes, with 16% of them making treks longer than an hour to the office in 2019. However, Oakland has one of the cheapest commutes, as workers there spend only 5.45% of their income on travel to work, the fourth-lowest rate for this metric overall.
7. Fremont, CA
Fremont, California, has seen a 4.3% increase in five years for workers commuting longer than 60 minutes on each trip, the fifth-highest in the study. Residents there also have the third-longest travel time, averaging 36.4 minutes on each commute, and the second-largest proportion of the workforce commuting longer than one hour, at 20.2%. Fremont workers, however, spend only 5.45% of their income on travel to work, tying for fourth-lowest for this metric.
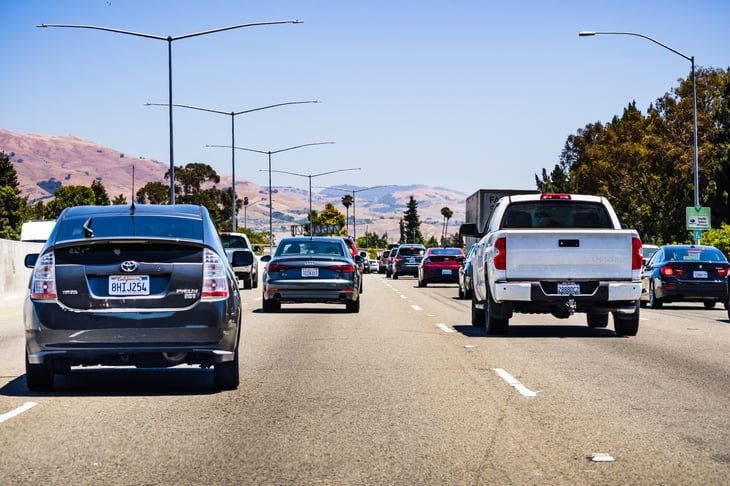
8. San Jose, CA

Located in the heart of Silicon Valley, San Jose, California, has the most affordable transportation on our list. Workers there spend only 5% of their income on travel to work. Despite those relatively low costs, San Jose still ranks as the eighth-worst commuting city on our list. Workers average 31.7 minutes on each commute, and they have seen a 14.44% increase in travel time over the five-year period from 2014 to 2019. Data also shows that San Jose has seen a 4.8% increase over that time period in commuters traveling more than one hour per trip.
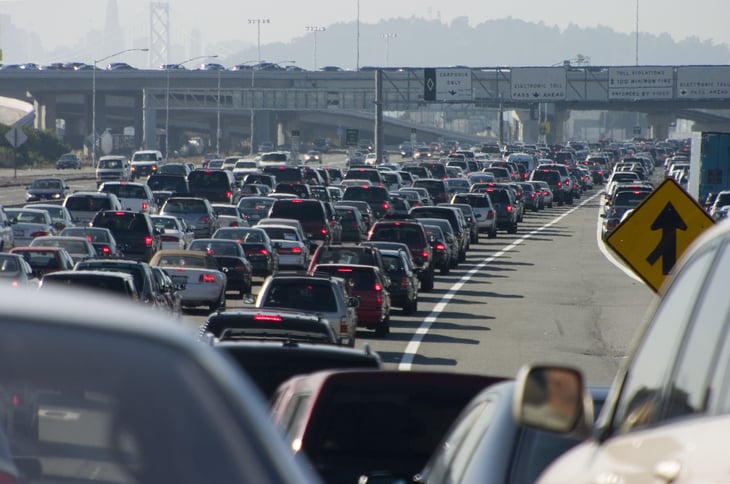
9. San Francisco, CA

San Francisco, California, workers average 34.7 minutes on each commute, the sixth-longest travel time in the study. The Bay Area city also has one of the largest groups of workers commuting the longest, with 15.7% needing more than 60 minutes to commute one way. That said, San Francisco workers have a relatively affordable commute, as residents there spend only 5.45% of their income on travel for work. The city ties for fourth-lowest out of 100 for this metric.
10. New York City, NY (tie)
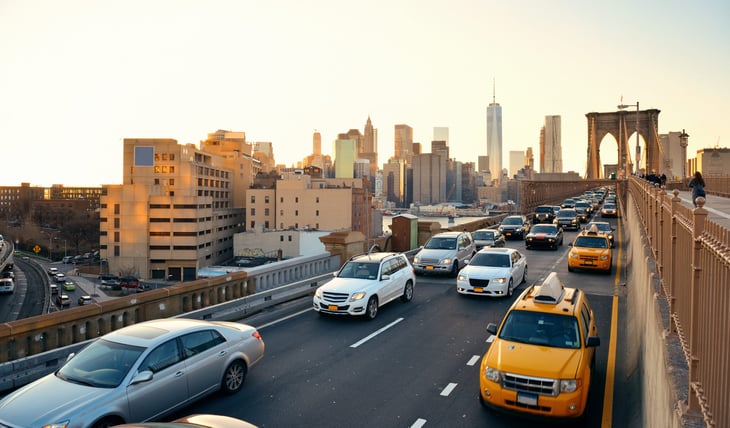
New York City ties with Long Beach, California, for the final spot in the 11 cities where residents have the worst commutes. The average travel time for New Yorkers is 41.7 minutes, the longest travel time in our study. New York City also has the highest percentage of workers who travel more than 60 minutes each way, at 27.2%. Despite the duration, the city ranks 16th-lowest out of 100 for transportation costs, with workers spending less than 8% of their income on commuting.
10. Long Beach, CA (tie)
Long Beach, California, ties with New York City as the 10th-worst U.S. city for residents’ commutes. Workers there have seen a 2.1% increase over the five-year period from 2014 to 2019 in the number of workers traveling more than one hour to work each day. Long Beach has the 12th-longest commute on our list, with workers averaging 32 minutes for each trip. And 14.9% of the workforce there travels longer than 60 minutes on each trip, the 12th-largest for this metric in the study.
Data and Methodology

To find the cities with the worst commutes, we compared the 100 largest cities in the country across the following metrics:
- Commuters as a percentage of workers. Data comes from the Census Bureau’s 2019 1-year American Community Survey.
- Average travel time to work in 2019. Data comes from the Census Bureau’s 2019 1-year American Community Survey.
- Five-year change in average travel time. Data comes from the Census Bureau’s 2019 and 2014 1-year American Community Surveys.
- Percentage of workers with a commute of longer than 60 minutes. Data comes from the Census Bureau’s 2019 1-year American Community Survey.
- Five-year change in percentage of workers with a commute of longer than 60 minutes. Data comes from the Census Bureau’s 2019 and 2014 1-year American Community Surveys.
- Transportation as a percentage of income. Data comes from the Census Bureau’s 2019 1-year American Community Survey and the March 2020 MIT Living Wage Study.
First, we ranked each city in each metric. We then found each city’s average ranking, giving all metrics an equal weight except for average travel time, which received a double weight. Next, we ranked the cities based on this average, giving the city with the highest average an index score of 100 and the city with the lowest average an index score of 0.
Add a Comment
Our Policy: We welcome relevant and respectful comments in order to foster healthy and informative discussions. All other comments may be removed. Comments with links are automatically held for moderation.