


Editor's Note: This story originally appeared on Smartest Dollar.
Racial and ethnic minorities are playing a greater role in the economy as America’s nonwhite population grows. Minority business enterprises have accounted for more than half of the new businesses created in the U.S. over the last decade, creating 4.7 million jobs in the process.
But minority entrepreneurs still face numerous barriers to success. Minorities have a more difficult time obtaining capital from external investors or lenders, which limits their ability to start and grow businesses. Minority owners are also less likely to have access to mentors and professional networks that can advise them effectively on business decisions.
In addition to these structural barriers, the COVID-19 pandemic was also particularly hard on minority-owned businesses. Minority-owned enterprises were more likely to face financial challenges, have decreased sales, reduce their operations, and have limited access to credit and federal relief funds.
Nearly 4 out of 5 employer firms in the U.S. are owned by people identifying as non-Hispanic white, while only 19% of businesses are owned by minorities. However, the total share of minority-owned businesses does not capture the full picture of minority underrepresentation among business owners. White Americans own 77% of businesses despite only representing 60% of the population. In contrast, other groups own a disproportionately low share of businesses. Hispanic individuals represent over 18% of the U.S. total with only 6% of businesses being Hispanic-owned, while Black Americans are over 12% of the population, but 2.3% of businesses are Black-owned.
To determine the locations with the most minority business owners, researchers at Smartest Dollar calculated the ratio of minority-owned businesses to the minority population. This was done by taking the percentage of businesses that are minority owned and dividing it by the minority population share. The researchers also calculated the percentage of total employment and total payroll at minority firms as well. The data in this analysis was sourced from the U.S. Census Bureau’s Annual Business Survey and American Community Survey.
Here are the metropolitan areas with the most minority business owners.
15. San Antonio-New Braunfels, TX

- Ratio of minority businesses to minority population: 0.44
- Percentage of businesses that are minority owned: 29.4%
- Minority population share: 66.8%
- Percentage of total employment at minority businesses: 11.4%
- Percentage of total payroll at minority businesses: 7.3%
14. Baltimore-Columbia-Towson, MD

- Ratio of minority businesses to minority population: 0.45
- Percentage of businesses that are minority owned: 20.2%
- Minority population share: 44.5%
- Percentage of total employment at minority businesses: 8.6%
- Percentage of total payroll at minority businesses: 5.7%

13. Dallas-Fort Worth-Arlington, TX

- Ratio of minority businesses to minority population: 0.46
- Percentage of businesses that are minority owned: 25.1%
- Minority population share: 55.1%
- Percentage of total employment at minority businesses: 9.7%
- Percentage of total payroll at minority businesses: 5.9%
12. Richmond, VA
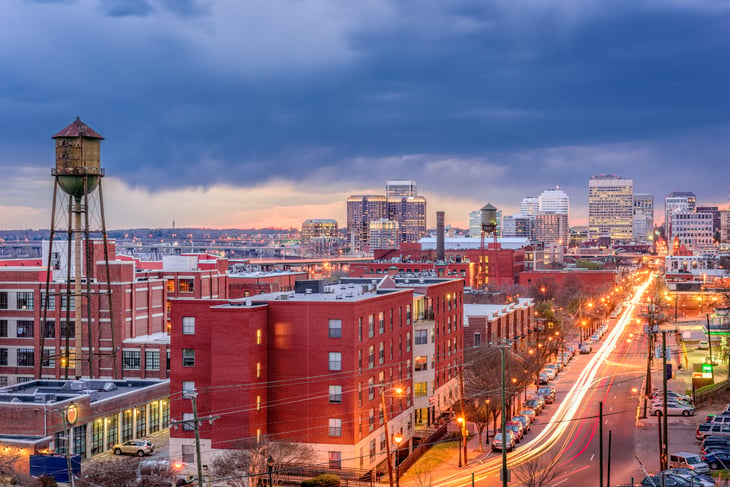
- Ratio of minority businesses to minority population: 0.47
- Percentage of businesses that are minority owned: 20.1%
- Minority population share: 43.0%
- Percentage of total employment at minority businesses: 7.3%
- Percentage of total payroll at minority businesses: 4.0%
11. St. Louis, MO-IL
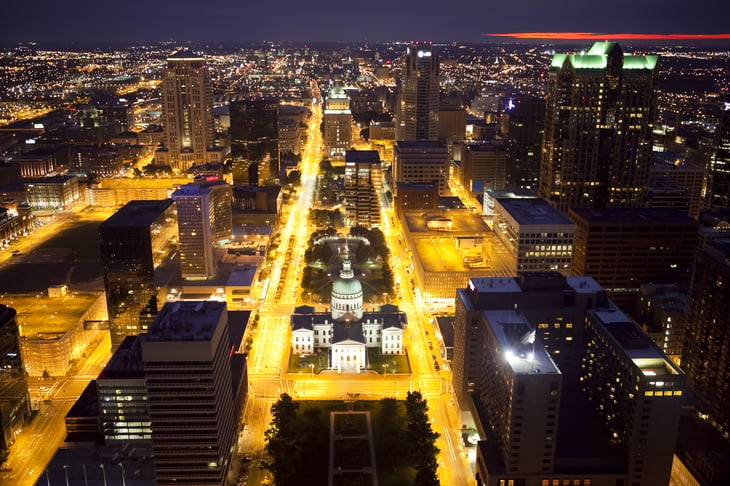
- Ratio of minority businesses to minority population: 0.48
- Percentage of businesses that are minority owned: 12.7%
- Minority population share: 26.6%
- Percentage of total employment at minority businesses: 4.0%
- Percentage of total payroll at minority businesses: 2.3%
10. Seattle-Tacoma-Bellevue, WA

- Ratio of minority businesses to minority population: 0.48
- Percentage of businesses that are minority owned: 18.4%
- Minority population share: 38.3%
- Percentage of total employment at minority businesses: 6.3%
- Percentage of total payroll at minority businesses: 3.7%
9. New York-Newark-Jersey City, NY-NJ-PA

- Ratio of minority businesses to minority population: 0.48
- Percentage of businesses that are minority owned: 26.3%
- Minority population share: 54.9%
- Percentage of total employment at minority businesses: 9.8%
- Percentage of total payroll at minority businesses: 5.3%
8. Portland-Vancouver-Hillsboro, OR-WA

- Ratio of minority businesses to minority population: 0.48
- Percentage of businesses that are minority owned: 13.3%
- Minority population share: 27.7%
- Percentage of total employment at minority businesses: 6.1%
- Percentage of total payroll at minority businesses: 3.4%
7. Orlando-Kissimmee-Sanford, FL
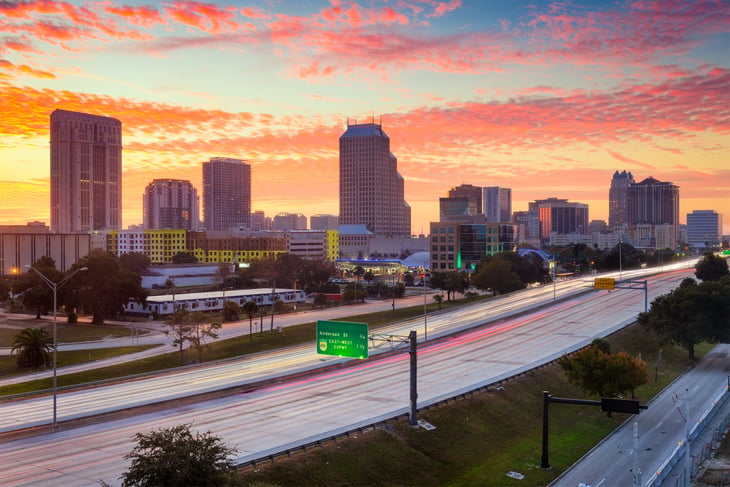
- Ratio of minority businesses to minority population: 0.49
- Percentage of businesses that are minority owned: 26.8%
- Minority population share: 54.8%
- Percentage of total employment at minority businesses: 7.0%
- Percentage of total payroll at minority businesses: 4.5%
6. Tampa-St. Petersburg-Clearwater, FL
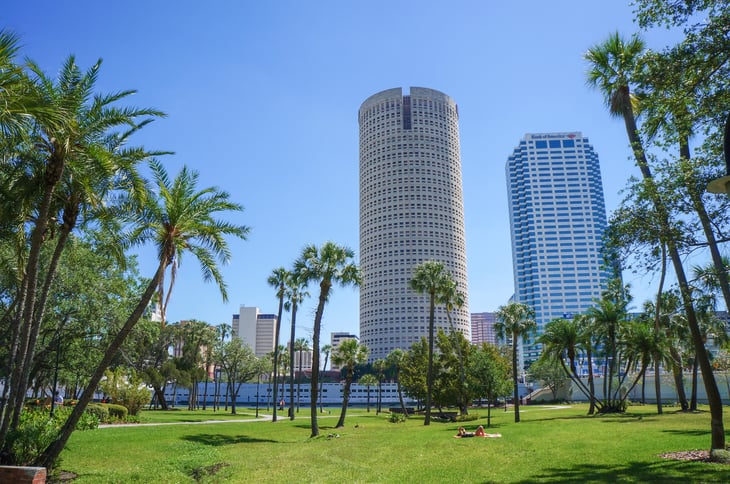
- Ratio of minority businesses to minority population: 0.49
- Percentage of businesses that are minority owned: 19.0%
- Minority population share: 38.6%
- Percentage of total employment at minority businesses: 7.9%
- Percentage of total payroll at minority businesses: 5.7%
5. Riverside-San Bernardino-Ontario, CA

- Ratio of minority businesses to minority population: 0.49
- Percentage of businesses that are minority owned: 34.2%
- Minority population share: 69.3%
- Percentage of total employment at minority businesses: 15.5%
- Percentage of total payroll at minority businesses: 12.7%
4. Houston-The Woodlands-Sugar Land, TX

- Ratio of minority businesses to minority population: 0.50
- Percentage of businesses that are minority owned: 32.2%
- Minority population share: 64.9%
- Percentage of total employment at minority businesses: 12.4%
- Percentage of total payroll at minority businesses: 6.4%
3. Los Angeles-Long Beach-Anaheim, CA

- Ratio of minority businesses to minority population: 0.52
- Percentage of businesses that are minority owned: 36.6%
- Minority population share: 70.8%
- Percentage of total employment at minority businesses: 17.3%
- Percentage of total payroll at minority businesses: 11.4%
2. Washington-Arlington-Alexandria, DC-VA-MD-WV
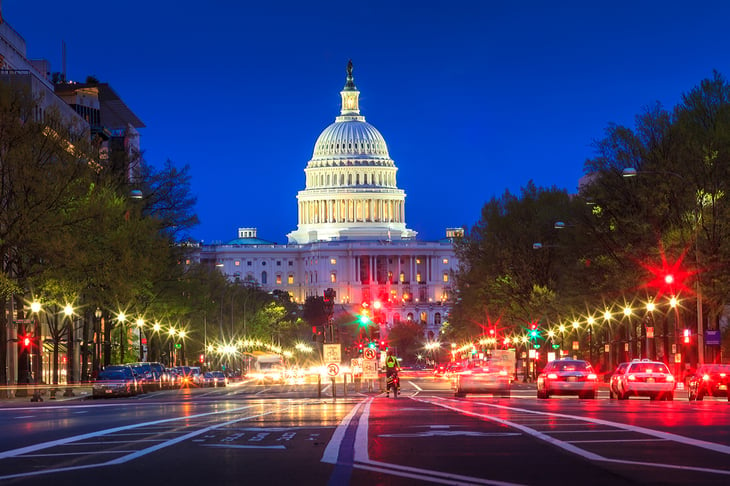
- Ratio of minority businesses to minority population: 0.57
- Percentage of businesses that are minority owned: 31.4%
- Minority population share: 55.3%
- Percentage of total employment at minority businesses: 13.0%
- Percentage of total payroll at minority businesses: 8.9%
1. San Jose-Sunnyvale-Santa Clara, CA
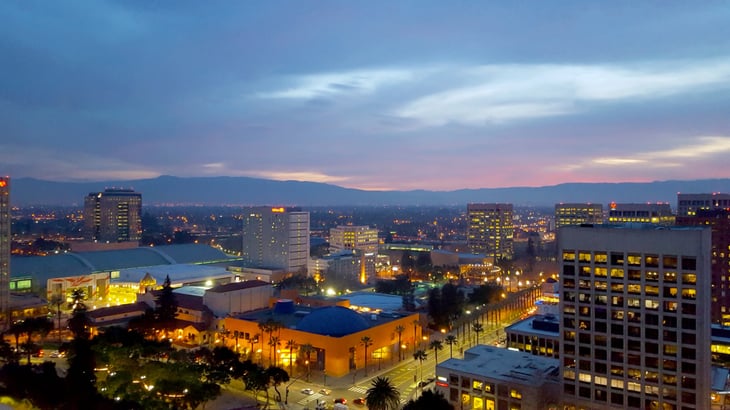
- Ratio of minority businesses to minority population: 0.61
- Percentage of businesses that are minority owned: 42.3%
- Minority population share: 69.5%
- Percentage of total employment at minority businesses: 13.7%
- Percentage of total payroll at minority businesses: 6.4%
Methodology

The data in this analysis was sourced from the U.S. Census Bureau’s Annual Business Survey and American Community Survey. To determine the locations with the most minority business owners, researchers at Smartest Dollar calculated the ratio of minority-owned businesses to the minority population.
This was done by taking the percentage of businesses that are minority owned — defined by having a “race code” of “minority” — and dividing it by the minority population share. For the purpose of this analysis, a person was considered to be a member of a minority group if they were not a non-Hispanic white person. The researchers also calculated the percentage of total employment at minority firms and the percentage of total payroll at minority businesses. To improve relevance, only metropolitan areas with at least 100,000 residents were included. Data that did not satisfy the U.S. Census Bureau’s publication standards were excluded.
Add a Comment
Our Policy: We welcome relevant and respectful comments in order to foster healthy and informative discussions. All other comments may be removed. Comments with links are automatically held for moderation.