


Editor's Note: This story originally appeared on Upgraded Points.
Over the past few years, rising inflation has put increasing financial pressure on American households, particularly those in the middle class.
While wages have grown in nominal terms, many workers feel they are falling behind as the cost of essentials — housing, groceries, and everyday expenses — continues to climb.
Public frustration over inflation remains high, with surveys consistently showing that Americans view the rising cost of living as one of the most pressing economic concerns.
This analysis examines how inflation-adjusted wages have changed across U.S. metropolitan areas.
By comparing wage growth to the increasing costs of goods and services, the findings reveal where worker pay has failed to keep pace, highlighting the cities where residents have lost the most purchasing power. For more details, see the methodology at the end.
Here the metro areas where wages aren’t keeping up with inflation.
15. Minneapolis-St. Paul-Bloomington, MN-WI

- Real Wage Growth: -5.2%
- Actual Wage Growth: +11.6%
- Overall Price Growth: +17.7%
- Housing Price Growth: +19.2%
- Grocery Price Growth: +24.4%

14. Riverside-San Bernardino-Ontario, CA

- Real Wage Growth: -5.6%
- Actual Wage Growth: +15.4%
- Overall Price Growth: +22.3%
- Housing Price Growth: +27.7%
- Grocery Price Growth: +20.2%

13. Los Angeles-Long Beach-Anaheim, CA

- Real Wage Growth: -6.1%
- Actual Wage Growth: +12.3%
- Overall Price Growth: +19.7%
- Housing Price Growth: +19.6%
- Grocery Price Growth: +23.2%
12. Atlanta-Sandy Springs-Roswell, GA
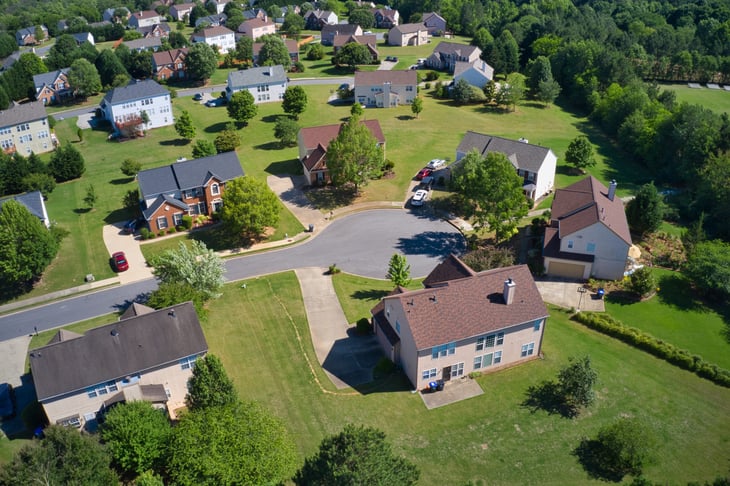
- Real Wage Growth: -7.2%
- Actual Wage Growth: +17.1%
- Overall Price Growth: +26.1%
- Housing Price Growth: +33.9%
- Grocery Price Growth: +18.4%

11. San Francisco-Oakland-Hayward, CA

- Real Wage Growth: -7.2%
- Actual Wage Growth: +6.6%
- Overall Price Growth: +14.9%
- Housing Price Growth: +10.2%
- Grocery Price Growth: +19.1%

10. Chicago-Naperville-Elgin, IL-IN-WI

- Real Wage Growth: -7.8%
- Actual Wage Growth: +11.2%
- Overall Price Growth: +20.7%
- Housing Price Growth: +22.9%
- Grocery Price Growth: +20.6%
9. San Diego-Carlsbad, CA

- Real Wage Growth: -7.9%
- Actual Wage Growth: +13.0%
- Overall Price Growth: +22.7%
- Housing Price Growth: +27.5%
- Grocery Price Growth: +19.3%
8. New York-Newark-Jersey City, NY-NJ-PA

- Real Wage Growth: -9.1%
- Actual Wage Growth: +8.2%
- Overall Price Growth: +19.1%
- Housing Price Growth: +18.8%
- Grocery Price Growth: +20.1%

7. Philadelphia-Camden-Wilmington, PA-NJ-DE-MD

- Real Wage Growth: -9.2%
- Actual Wage Growth: +10.5%
- Overall Price Growth: +21.8%
- Housing Price Growth: +25.0%
- Grocery Price Growth: +25.8%

6. Miami-Fort Lauderdale-West Palm Beach, FL
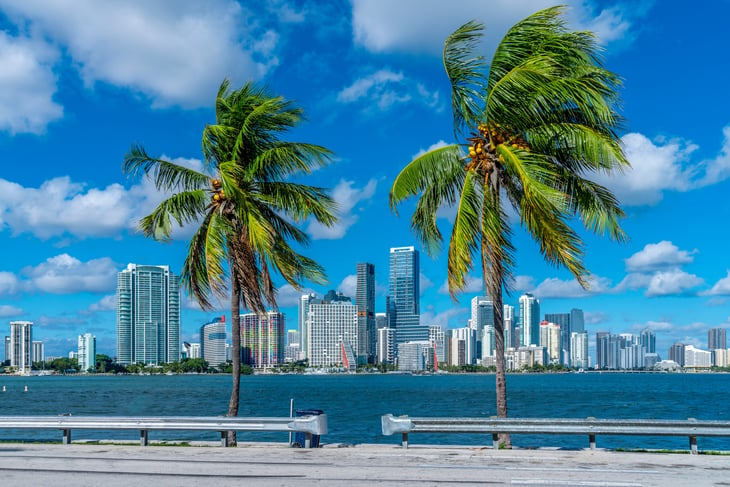
- Real Wage Growth: -9.5%
- Actual Wage Growth: +15.7%
- Overall Price Growth: +27.9%
- Housing Price Growth: +39.5%
- Grocery Price Growth: +13.3%
5. Seattle-Tacoma-Bellevue, WA
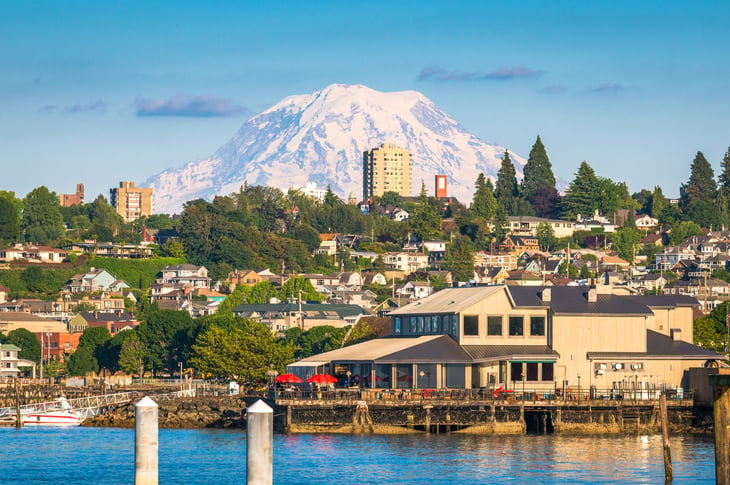
- Real Wage Growth: -10.4%
- Actual Wage Growth: +12.1%
- Overall Price Growth: +25.0%
- Housing Price Growth: +26.2%
- Grocery Price Growth: +23.9%
4. Washington-Arlington-Alexandria, DC-VA-MD-WV

- Real Wage Growth: -11.2%
- Actual Wage Growth: +4.7%
- Overall Price Growth: +17.9%
- Housing Price Growth: +16.7%
- Grocery Price Growth: +18.6%

3. Boston-Cambridge-Newton, MA-NH

- Real Wage Growth: -11.2%
- Actual Wage Growth: +5.6%
- Overall Price Growth: +18.9%
- Housing Price Growth: +22.2%
- Grocery Price Growth: +18.2%

2. Dallas-Fort Worth-Arlington, TX

- Real Wage Growth: -12.1%
- Actual Wage Growth: +9.7%
- Overall Price Growth: +24.9%
- Housing Price Growth: +29.6%
- Grocery Price Growth: +25.9%
1. Baltimore-Columbia-Towson, MD
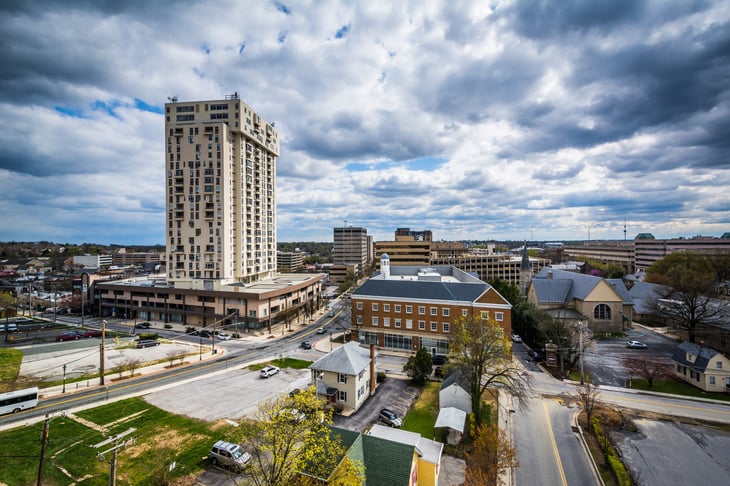
- Real Wage Growth: -14.0%
- Actual Wage Growth: +4.2%
- Overall Price Growth: +21.1%
- Housing Price Growth: +20.0%
- Grocery Price Growth: +25.2%

Methodology

This analysis examines the gap between wage growth and rising costs by comparing inflation-adjusted earnings across U.S. metropolitan areas.
Data sources include the U.S. Bureau of Labor Statistics (BLS), specifically the Consumer Price Index (CPI) and Current Employment Statistics (CES) programs, as well as the Upgraded Points February 2025 Financial Pulse Survey, a proprietary survey of U.S. adults.
To assess where wages have failed to keep pace with inflation, researchers calculated the percentage change in real (inflation-adjusted) earnings from December 2020 to December 2024. December 2020 was chosen as the starting point because it marks the period just before inflation began accelerating rapidly in 2021.
However, because BLS only reports inflation data on odd months for certain metros, November 2020 and November 2024 figures were used for those locations instead.
The study utilized the following CPI measures:
- Overall price growth is based on the “All Items” CPI
- Housing price growth is based on the “Shelter” CPI
- Grocery price growth is based on the “Food at Home” CPI
Only metropolitan statistical areas (MSAs) with complete and consistent data across both BLS surveys were included in the analysis.


Add a Comment