


Editor's Note: This story originally appeared on Construction Coverage.
The U.S. housing market has experienced significant shifts over the past two decades, from the early 2000s housing boom to the Great Recession’s crash, followed by the recovery and record-breaking price surges during the COVID-19 pandemic.
While some regions have seen wild price swings, others have remained relatively steady, offering homeowners a greater sense of stability over time. Understanding which markets have been the most stable can help homebuyers, investors, and policymakers anticipate risks and make informed decisions.
To assess long-term housing market stability, researchers at Construction Coverage analyzed home price trends across states and major U.S. metro areas using Zillow data from 2000 to present. Find details on the methodology at the end.
Here are the U.S. metropolitan areas with the most stable housing markets.
15. Dallas, TX

- Chance of experiencing a 5% price drop (2000-present): 22.4%
- Largest price drop (2000-present): $16,386
- Largest price drop % (2000-present): 10.6%
- Median home price: $368,397
- Percentage change in home price (2000-present): 195%
14. Virginia Beach, VA
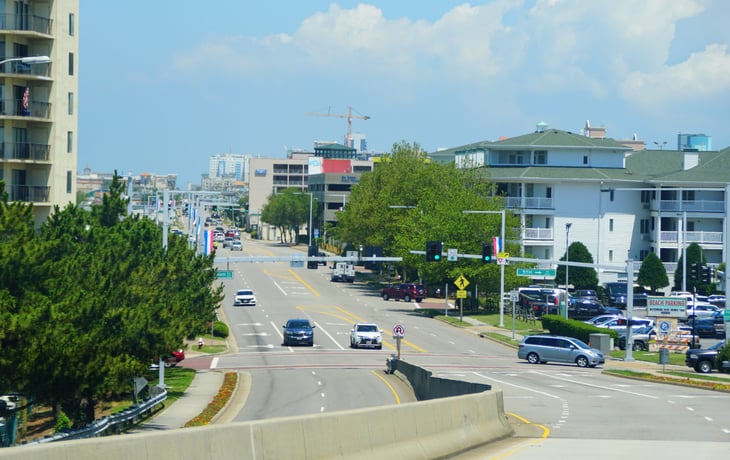
- Chance of experiencing a 5% price drop (2000-present): 21.4%
- Largest price drop (2000-present): $44,615
- Largest price drop % (2000-present): 18.0%
- Median home price: $349,273
- Percentage change in home price (2000-present): 202%

13. Salt Lake City, UT

- Chance of experiencing a 5% price drop (2000-present): 20.7%
- Largest price drop (2000-present): $72,137
- Largest price drop % (2000-present): 27.6%
- Median home price: $543,783
- Percentage change in home price (2000-present): 215%
12. Louisville, KY
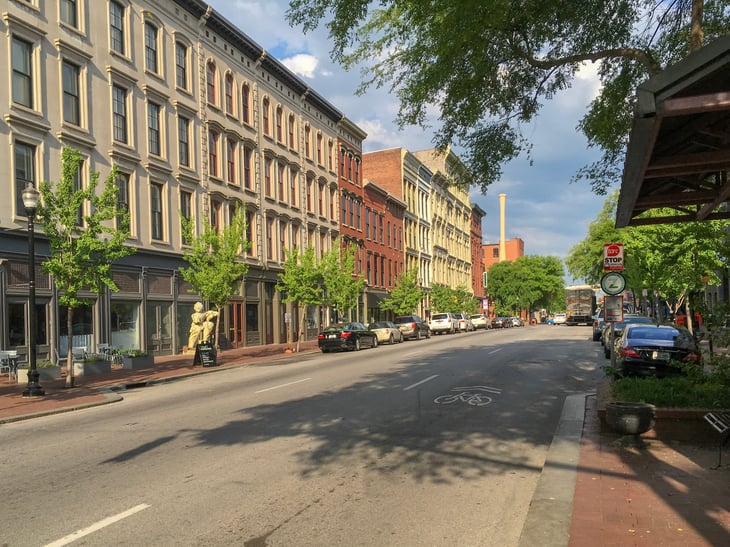
- Chance of experiencing a 5% price drop (2000-present): 20.1%
- Largest price drop (2000-present): $11,766
- Largest price drop % (2000-present): 8.5%
- Median home price: $256,335
- Percentage change in home price (2000-present): 139%

11. Raleigh, NC
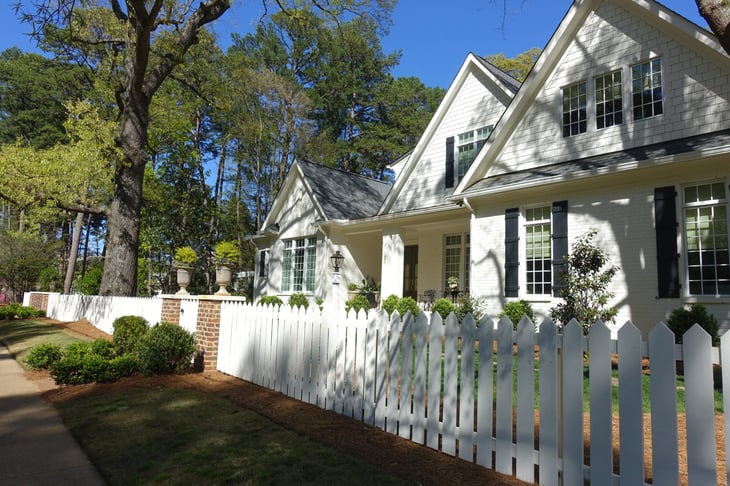
- Chance of experiencing a 5% price drop (2000-present): 19.1%
- Largest price drop (2000-present): $29,180
- Largest price drop % (2000-present): 13.2%
- Median home price: $439,131
- Percentage change in home price (2000-present): 158%
10. Washington, D.C.
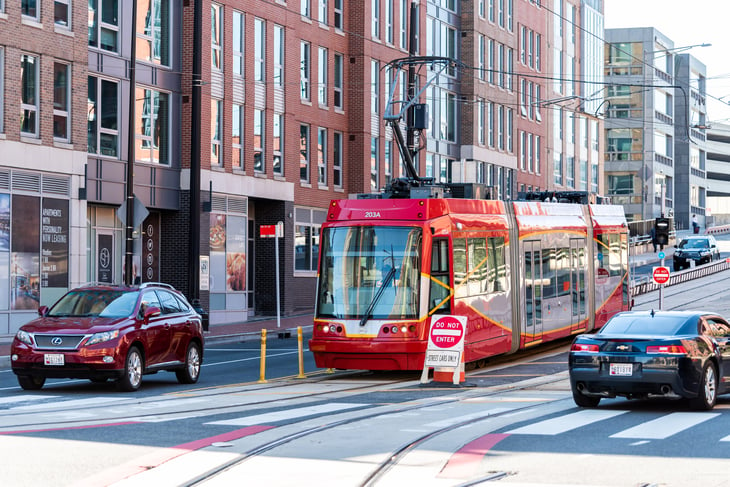
- Chance of experiencing a 5% price drop (2000-present): 18.4%
- Largest price drop (2000-present): $125,944
- Largest price drop % (2000-present): 28.8%
- Median home price: $568,279
- Percentage change in home price (2000-present): 217%

9. Nashville, TN
- Chance of experiencing a 5% price drop (2000-present): 18.4%
- Largest price drop (2000-present): $24,438
- Largest price drop % (2000-present): 13.0%
- Median home price: $435,739
- Percentage change in home price (2000-present): 217%

8. Houston, TX
- Chance of experiencing a 5% price drop (2000-present): 17.4%
- Largest price drop (2000-present): $15,108
- Largest price drop % (2000-present): 9.8%
- Median home price: $306,317
- Percentage change in home price (2000-present): 152%
7. Austin, TX
- Chance of experiencing a 5% price drop (2000-present): 17.1%
- Largest price drop (2000-present): $104,950
- Largest price drop % (2000-present): 19.1%
- Median home price: $443,401
- Percentage change in home price (2000-present): 162%

6. San Antonio, TX

- Chance of experiencing a 5% price drop (2000-present): 11.0%
- Largest price drop (2000-present): $18,624
- Largest price drop % (2000-present): 8.9%
- Median home price: $280,648
- Percentage change in home price (2000-present): 150%

5. Tulsa, OK

- Chance of experiencing a 5% price drop (2000-present): 10.7%
- Largest price drop (2000-present): $8,607
- Largest price drop % (2000-present): 6.8%
- Median home price: $231,831
- Percentage change in home price (2000-present): 137%
4. Rochester, NY

- Chance of experiencing a 5% price drop (2000-present): 4.7%
- Largest price drop (2000-present): $7,225
- Largest price drop % (2000-present): 5.7%
- Median home price: $249,581
- Percentage change in home price (2000-present): 160%

3. Pittsburgh, PA
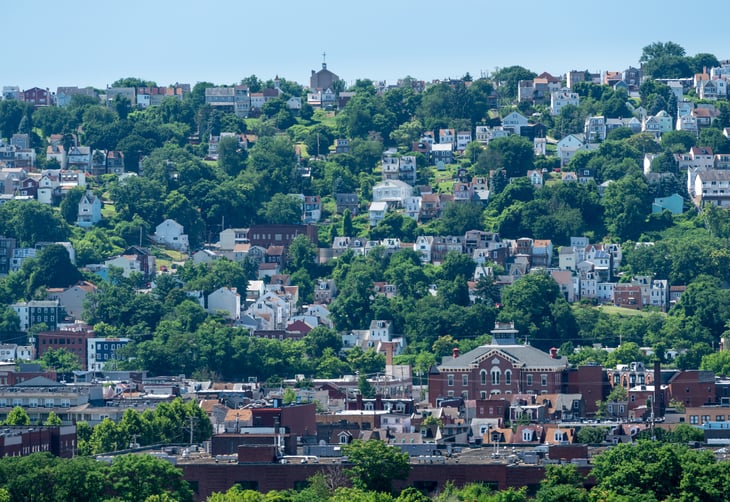
- Chance of experiencing a 5% price drop (2000-present): 0.0%
- Largest price drop (2000-present): $5,973
- Largest price drop % (2000-present): 3.0%
- Median home price: $207,927
- Percentage change in home price (2000-present): 154%

2. Oklahoma City, OK
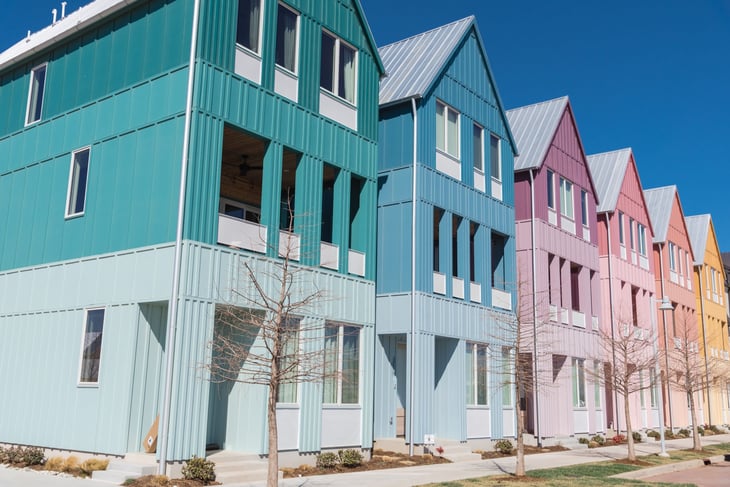
- Chance of experiencing a 5% price drop (2000-present): 0.0%
- Largest price drop (2000-present): $5,422
- Largest price drop % (2000-present): 4.3%
- Median home price: $230,229
- Percentage change in home price (2000-present): 160%

1. Buffalo, NY

- Chance of experiencing a 5% price drop (2000-present): 0.0%
- Largest price drop (2000-present): $3,659
- Largest price drop % (2000-present): 2.9%
- Median home price: $258,121
- Percentage change in home price (2000-present): 203%

Methodology

To determine the locations with the most stable housing markets, researchers at Construction Coverage analyzed the latest data from the Zillow Home Value Index (ZHVI), a measure of typical home value.
The researchers ranked metros according to the probability that a random buyer purchasing a home at any point between 2000 and present would have experienced a greater-than-5% price drop following the purchase. In the event of a tie, the location with the lowest price drop from 2000 to present was ranked higher.
Researchers also calculated the current median home price — using the most recent ZHVI — and the percentage change in home price from 2000 to present. Locations missing two or more consecutive months of ZHVI data were excluded from the analysis.
For metros missing single months of data, missing values were imputed using an average of the ZHVI for the months immediately before and after.

Add a Comment