



Editor's Note: This story originally appeared on Construction Coverage.
The U.S. housing market has long followed seasonal patterns, with home prices often rising in the spring and summer as warmer weather and the end of the school year spur more buying and selling activity. In contrast, fall and winter typically see fewer transactions and lower prices as demand softens.
These predictable cycles have historically influenced home prices and sales volume throughout the year, offering attractive opportunities for buyers or sellers who time the market right.
However, the COVID-19 pandemic disrupted these patterns. Low mortgage rates, heightened demand, and shifting preferences for larger homes during the remote-work era fueled a year-round surge in prices, with many cities experiencing minimal seasonal slowdowns.
As the market stabilizes from these major disruptions, some areas are returning to pre-pandemic norms, while others continue to see a significant divergence from typical price patterns.
To determine the locations with the biggest seasonal changes in home prices, researchers at Construction Coverage used data from Redfin.
Following is a breakdown of the top cities for home sales price seasonality. For more information on how each statistic was computed, see the methodology section at the end.
15. Philadelphia, PA

- Median home sale price seasonal change (2014-2023 average): -19.5%
- Total days on market seasonal change (2014-2023 average): +89.6%
- Month for highest median home sale price (2023): July
- Month for lowest median home sale price (2023): November
- Median home sale price (current): $250,000
14. Houston, TX
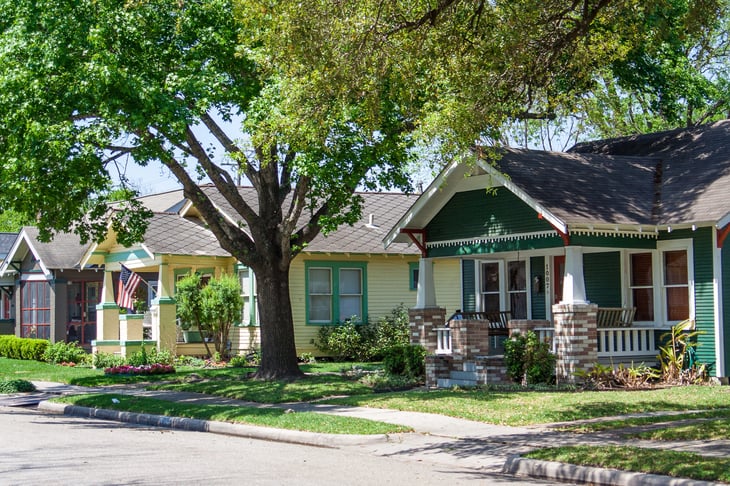
- Median home sale price seasonal change (2014-2023 average): -19.6%
- Total days on market seasonal change (2014-2023 average): +117.3%
- Month for highest median home sale price (2023): May
- Month for lowest median home sale price (2023): January
- Median home sale price (current): $353,200
13. Kansas City, MO
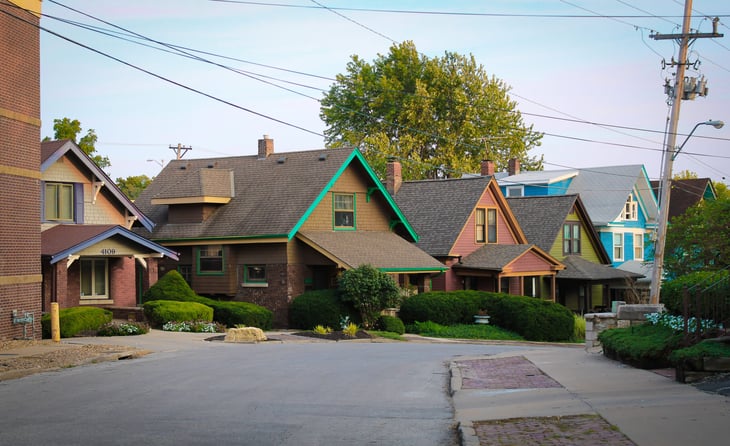
- Median home sale price seasonal change (2014-2023 average): -20.4%
- Total days on market seasonal change (2014-2023 average): +115.7%
- Month for highest median home sale price (2023): June
- Month for lowest median home sale price (2023): February
- Median home sale price (current): $290,000
12. New Orleans, LA

- Median home sale price seasonal change (2014-2023 average): -21.1%
- Total days on market seasonal change (2014-2023 average): +100.5%
- Month for highest median home sale price (2023): June
- Month for lowest median home sale price (2023): December
- Median home sale price (current): $315,000
11. Atlanta, GA
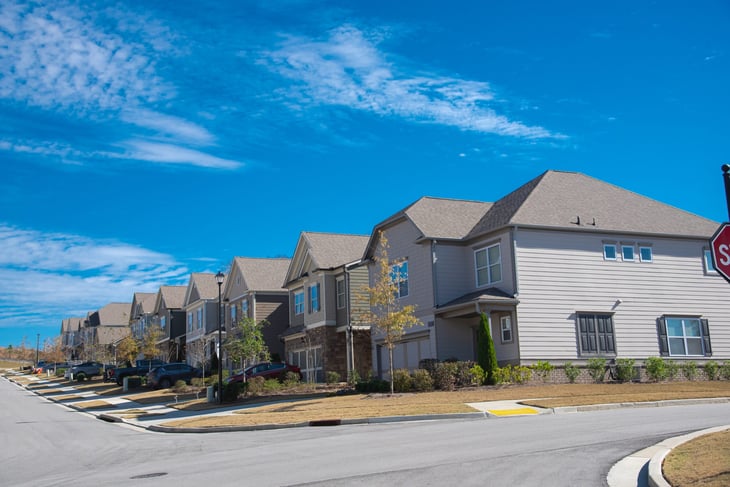
- Median home sale price seasonal change (2014-2023 average): -21.1%
- Total days on market seasonal change (2014-2023 average): +118.3%
- Month for highest median home sale price (2023): May
- Month for lowest median home sale price (2023): January
- Median home sale price (current): $392,000
10. Tulsa, OK
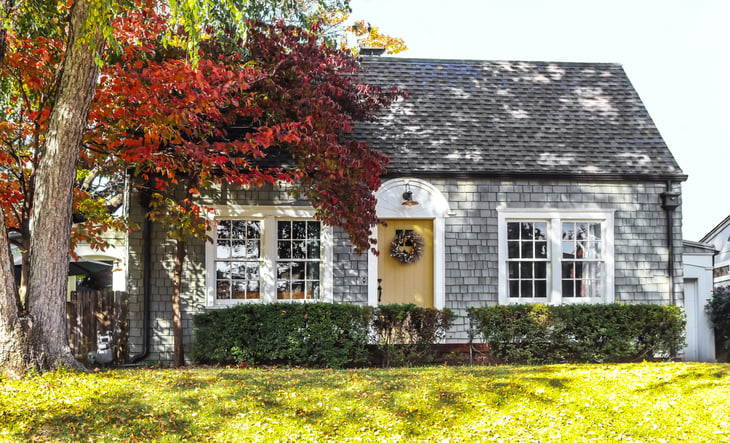
- Median home sale price seasonal change (2014-2023 average): -23%
- Total days on market seasonal change (2014-2023 average): +159.3%
- Month for highest median home sale price (2023): July
- Month for lowest median home sale price (2023): February
- Median home sale price (current): $239,000
9. Tampa, FL
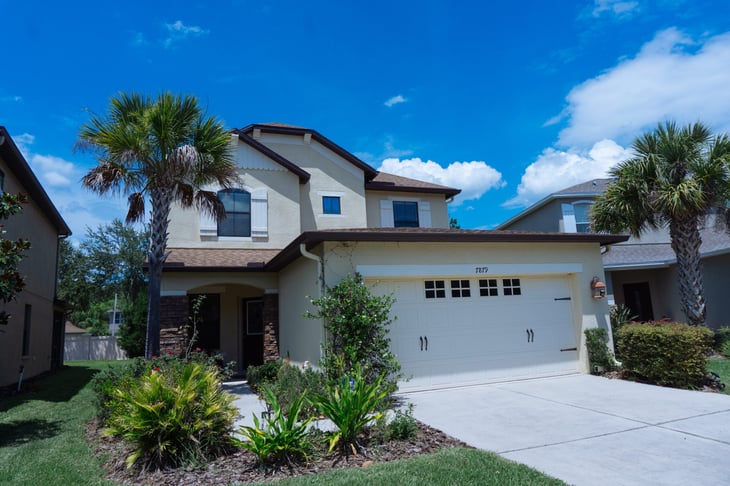
- Median home sale price seasonal change (2014-2023 average): -23.2%
- Total days on market seasonal change (2014-2023 average): +118.1%
- Month for highest median home sale price (2023): August
- Month for lowest median home sale price (2023): February
- Median home sale price (current): $447,000

8. Chicago, IL
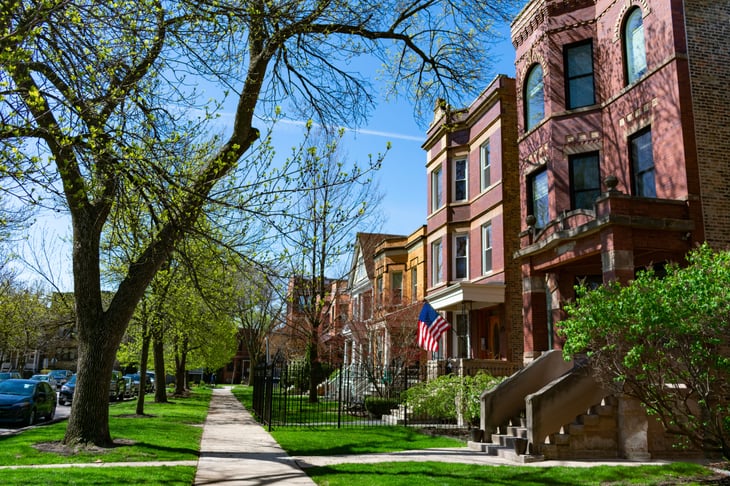
- Median home sale price seasonal change (2014-2023 average): -23.3%
- Total days on market seasonal change (2014-2023 average): +91.2%
- Month for highest median home sale price (2023): June
- Month for lowest median home sale price (2023): January
- Median home sale price (current): $360,000

7. Oakland, CA

- Median home sale price seasonal change (2014-2023 average): -24.3%
- Total days on market seasonal change (2014-2023 average): +146.1%
- Month for highest median home sale price (2023): March
- Month for lowest median home sale price (2023): January
- Median home sale price (current): $812,500

6. Dallas, TX
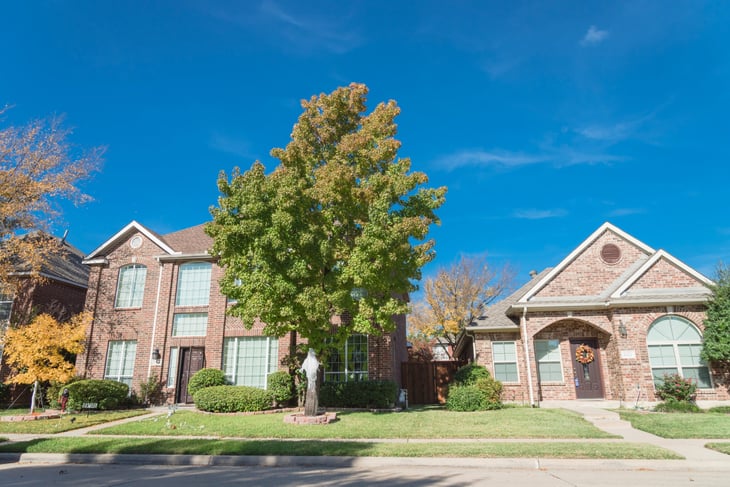
- Median home sale price seasonal change (2014-2023 average): -26.8%
- Total days on market seasonal change (2014-2023 average): +92%
- Month for highest median home sale price (2023): June
- Month for lowest median home sale price (2023): January
- Median home sale price (current): $412,500

5. Memphis, TN
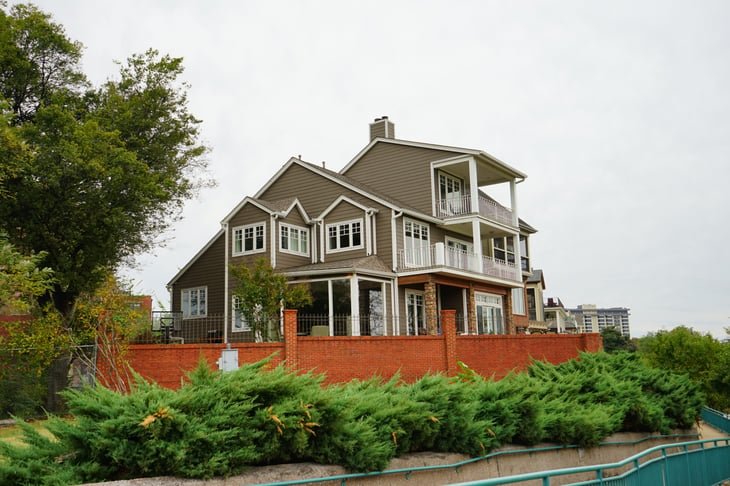
- Median home sale price seasonal change (2014-2023 average): -28.5%
- Total days on market seasonal change (2014-2023 average): +60.5%
- Month for highest median home sale price (2023): May
- Month for lowest median home sale price (2023): September
- Median home sale price (current): $182,000

4. Milwaukee, WI
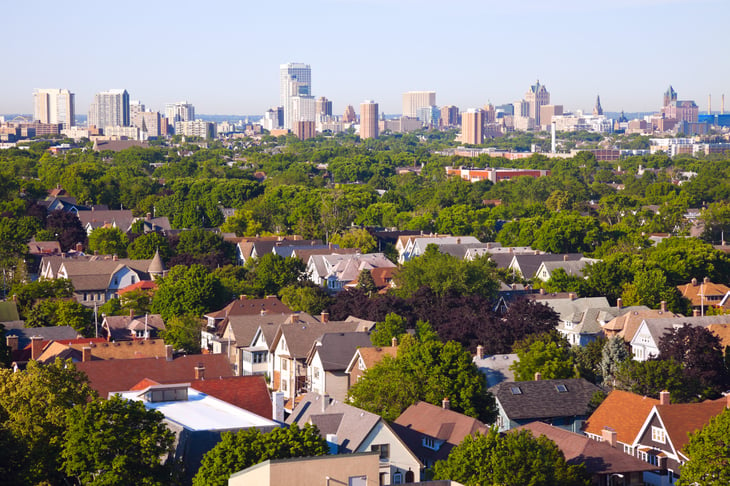
- Median home sale price seasonal change (2014-2023 average): -28.7%
- Total days on market seasonal change (2014-2023 average): +56.7%
- Month for highest median home sale price (2023): September
- Month for lowest median home sale price (2023): February
- Median home sale price (current): $225,000

3. Detroit, MI

- Median home sale price seasonal change (2014-2023 average): -33.5%
- Total days on market seasonal change (2014-2023 average): +77.5%
- Month for highest median home sale price (2023): October
- Month for lowest median home sale price (2023): February
- Median home sale price (current): $91,000

2. Cleveland, OH

- Median home sale price seasonal change (2014-2023 average): -35.3%
- Total days on market seasonal change (2014-2023 average): +84%
- Month for highest median home sale price (2023): April
- Month for lowest median home sale price (2023): January
- Median home sale price (current): $125,000

1. Baltimore, MD
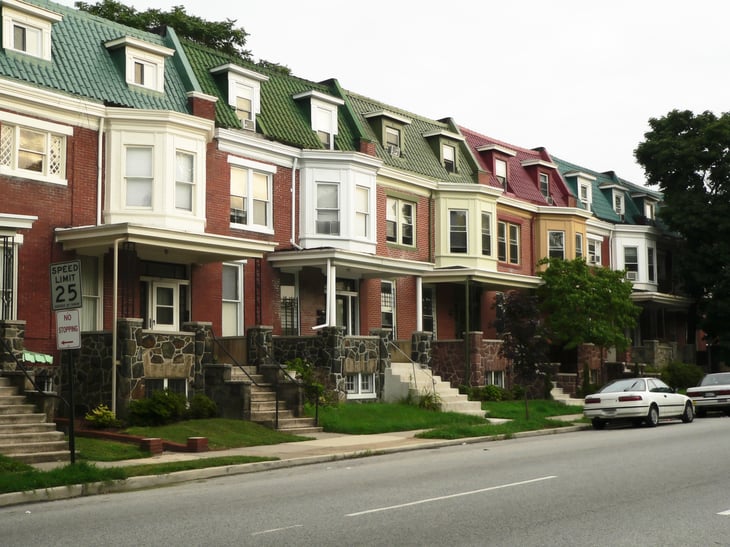
- Median home sale price seasonal change (2014-2023 average): -38.3%
- Total days on market seasonal change (2014-2023 average): +97%
- Month for highest median home sale price (2023): June
- Month for lowest median home sale price (2023): January
- Median home sale price (current): $230,000

Methodology

The data used in this analysis is from Redfin’s Data Center.
To determine the locations with the biggest seasonal changes in home prices, researchers at Construction Coverage calculated the average of the differences between the highest and lowest median home sale months from 2014 through 2023.
Due to the anomalous nature of home sales during 2020 and 2021, data from those years were omitted.
Locations with bigger seasonal changes were ranked higher, and in the event of a tie, the location with the greater total days on market seasonal change was ranked higher.
To improve relevance, only cities with sufficient data and an annual average of more than 1,500 homes sold were included in the analysis.


Add a Comment