



Editor's Note: This story originally appeared on Trace One.
Over the past several decades, the health of the average American has steadily declined, marked by rising rates of obesity, diabetes, and other chronic conditions.
These are not merely individual challenges but national ones, placing immense strain on the U.S. health care system. Chronic diseases — many of which are tied to poor diet — account for 90% of the nation’s $4.5 trillion in annual health care spending.
The consequences of these health crises are glaring when compared to other wealthy nations. Despite spending more on health care per capita than any other country, the U.S. lags behind its peers in life expectancy.
Amidst these alarming statistics, a cultural shift is gaining momentum: the call to “Make America Healthy Again.” Central to this movement is a focus on improving dietary habits, as research increasingly highlights the profound impact of diet on overall health.
Certain states stand out as having the healthiest diets overall. To find those states, researchers at Trace One conducted an analysis using data from the CDC and USDA. For more information, refer to the methodology section at the end.
Following is a breakdown of the states with the healthiest diets.
15. Connecticut

- Healthy diet index: 61.4
- Consume fruits daily: 64.6%
- Consume vegetables daily: 80.0%
- Drink alcohol moderately or don’t drink: 94.1%
- Drink sugar-sweetened beverages daily: 72.2%
- Food insecurity: 10.4%
- Overweight or obesity prevalence: 65.9%
- Diabetes prevalence: 9.9%
- High cholesterol prevalence: 38.6%
- High blood pressure prevalence: 32.0%
- Coronary heart disease or heart attack prevalence: 5.9%
14. New York

- Healthy diet index: 62.8
- Consume fruits daily: 64.3%
- Consume vegetables daily: 79.3%
- Drink alcohol moderately or don’t drink: 95.0%
- Drink sugar-sweetened beverages daily: 65.6%
- Food insecurity: 12.3%
- Overweight or obesity prevalence: 64.1%
- Diabetes prevalence: 10.6%
- High cholesterol prevalence: 38.5%
- High blood pressure prevalence: 32.1%
- Coronary heart disease or heart attack prevalence: 6.1%

13. Oregon

- Healthy diet index: 64.6
- Consume fruits daily: 62.3%
- Consume vegetables daily: 83.6%
- Drink alcohol moderately or don’t drink: 93.2%
- Drink sugar-sweetened beverages daily: 51.5%
- Food insecurity: 12.8%
- Overweight or obesity prevalence: 67.0%
- Diabetes prevalence: 10.9%
- High cholesterol prevalence: 34.2%
- High blood pressure prevalence: 33.5%
- Coronary heart disease or heart attack prevalence: 6.2%

12. New Jersey

- Healthy diet index: 65.8
- Consume fruits daily: 64.9%
- Consume vegetables daily: 78.7%
- Drink alcohol moderately or don’t drink: 95.7%
- Drink sugar-sweetened beverages daily: 69.5%
- Food insecurity: 9.8%
- Overweight or obesity prevalence: 64.8%
- Diabetes prevalence: 10.5%
- High cholesterol prevalence: 39.1%
- High blood pressure prevalence: 33.4%
- Coronary heart disease or heart attack prevalence: 5.0%

11. Alaska

- Healthy diet index: 66.4
- Consume fruits daily: 57.9%
- Consume vegetables daily: 81.5%
- Drink alcohol moderately or don’t drink: 91.6%
- Drink sugar-sweetened beverages daily: 44.5%
- Food insecurity: 10.4%
- Overweight or obesity prevalence: 68.4%
- Diabetes prevalence: 8.7%
- High cholesterol prevalence: 34.2%
- High blood pressure prevalence: 33.8%
- Coronary heart disease or heart attack prevalence: 5.7%
10. New Hampshire

- Healthy diet index: 66.6
- Consume fruits daily: 64.3%
- Consume vegetables daily: 84.7%
- Drink alcohol moderately or don’t drink: 92.3%
- Drink sugar-sweetened beverages daily: 69.7%
- Food insecurity: 7.4%
- Overweight or obesity prevalence: 68.4%
- Diabetes prevalence: 9.8%
- High cholesterol prevalence: 35.8%
- High blood pressure prevalence: 33.3%
- Coronary heart disease or heart attack prevalence: 5.6%
9. Montana

- Healthy diet index: 67.4
- Consume fruits daily: 60.0%
- Consume vegetables daily: 83.1%
- Drink alcohol moderately or don’t drink: 91.8%
- Drink sugar-sweetened beverages daily: 64.9%
- Food insecurity: 10.6%
- Overweight or obesity prevalence: 65.7%
- Diabetes prevalence: 9.4%
- High cholesterol prevalence: 34.0%
- High blood pressure prevalence: 32.2%
- Coronary heart disease or heart attack prevalence: 6.1%

8. California
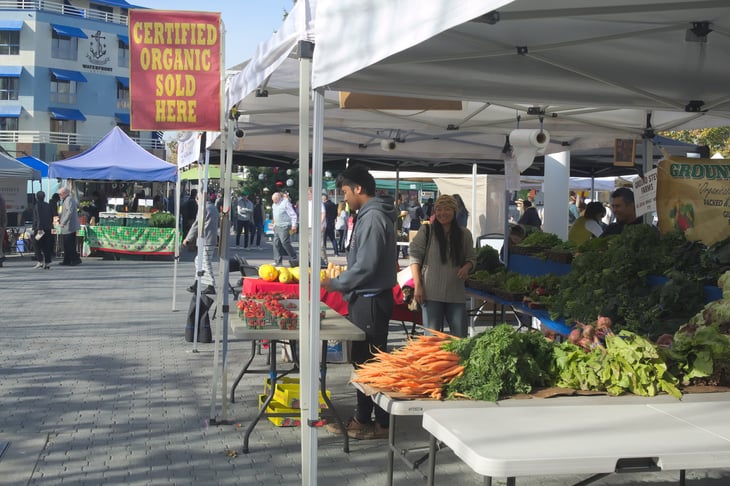
- Healthy diet index: 68.6
- Consume fruits daily: 63.8%
- Consume vegetables daily: 77.5%
- Drink alcohol moderately or don’t drink: 95.2%
- Drink sugar-sweetened beverages daily: 62.7%
- Food insecurity: 11.4%
- Overweight or obesity prevalence: 64.1%
- Diabetes prevalence: 11.5%
- High cholesterol prevalence: 37.0%
- High blood pressure prevalence: 30.6%
- Coronary heart disease or heart attack prevalence: 5.2%

7. Idaho

- Healthy diet index: 73.0
- Consume fruits daily: 58.3%
- Consume vegetables daily: 83.8%
- Drink alcohol moderately or don’t drink: 94.1%
- Drink sugar-sweetened beverages daily: 58.8%
- Food insecurity: 11.3%
- Overweight or obesity prevalence: 66.7%
- Diabetes prevalence: 9.8%
- High cholesterol prevalence: 34.4%
- High blood pressure prevalence: 31.2%
- Coronary heart disease or heart attack prevalence: 5.7%

6. Massachusetts

- Healthy diet index: 74.0
- Consume fruits daily: 63.3%
- Consume vegetables daily: 82.9%
- Drink alcohol moderately or don’t drink: 93.6%
- Drink sugar-sweetened beverages daily: 66.8%
- Food insecurity: 9.3%
- Overweight or obesity prevalence: 62.6%
- Diabetes prevalence: 9.8%
- High cholesterol prevalence: 35.7%
- High blood pressure prevalence: 31.0%
- Coronary heart disease or heart attack prevalence: 5.7%
5. Vermont

- Healthy diet index: 75.0
- Consume fruits daily: 66.0%
- Consume vegetables daily: 86.2%
- Drink alcohol moderately or don’t drink: 92.4%
- Drink sugar-sweetened beverages daily: 67.3%
- Food insecurity: 9.2%
- Overweight or obesity prevalence: 63.6%
- Diabetes prevalence: 9.3%
- High cholesterol prevalence: 33.1%
- High blood pressure prevalence: 32.4%
- Coronary heart disease or heart attack prevalence: 6.0%

4. Minnesota

- Healthy diet index: 75.6
- Consume fruits daily: 63.6%
- Consume vegetables daily: 79.4%
- Drink alcohol moderately or don’t drink: 94.1%
- Drink sugar-sweetened beverages daily: 50.4%
- Food insecurity: 9.1%
- Overweight or obesity prevalence: 67.4%
- Diabetes prevalence: 10.5%
- High cholesterol prevalence: 33.8%
- High blood pressure prevalence: 31.1%
- Coronary heart disease or heart attack prevalence: 6.0%

3. Washington

- Healthy diet index: 78.8
- Consume fruits daily: 63.9%
- Consume vegetables daily: 81.0%
- Drink alcohol moderately or don’t drink: 93.6%
- Drink sugar-sweetened beverages daily: 55.0%
- Food insecurity: 9.5%
- Overweight or obesity prevalence: 65.8%
- Diabetes prevalence: 9.6%
- High cholesterol prevalence: 36.2%
- High blood pressure prevalence: 30.6%
- Coronary heart disease or heart attack prevalence: 5.2%
2. Colorado

- Healthy diet index: 81.4
- Consume fruits daily: 61.9%
- Consume vegetables daily: 81.4%
- Drink alcohol moderately or don’t drink: 93.3%
- Drink sugar-sweetened beverages daily: 59.4%
- Food insecurity: 9.9%
- Overweight or obesity prevalence: 59.8%
- Diabetes prevalence: 8.6%
- High cholesterol prevalence: 32.5%
- High blood pressure prevalence: 27.3%
- Coronary heart disease or heart attack prevalence: 4.8%
1. Utah

- Healthy diet index: 84.2
- Consume fruits daily: 62.3%
- Consume vegetables daily: 80.0%
- Drink alcohol moderately or don’t drink: 96.1%
- Drink sugar-sweetened beverages daily: 53.6%
- Food insecurity: 11.8%
- Overweight or obesity prevalence: 64.5%
- Diabetes prevalence: 7.8%
- High cholesterol prevalence: 31.2%
- High blood pressure prevalence: 27.3%
- Coronary heart disease or heart attack prevalence: 4.4%

Methodology

The data used in this study comes from the U.S. Centers for Disease Control and Prevention’s Behavioral Risk Factor Surveillance System (BRFSS) and National Health Interview Survey, as well as the U.S. Department of Agriculture’s Economic Research Service.
To determine the states with the healthiest diets, researchers created a composite healthy diet index based on the following factors, all weighted evenly:
- Share of adults who consume fruits daily (higher is better)
- Share of adults who consume vegetables daily (higher is better)
- Share of adults who either don’t drink alcohol or drink moderately (higher is better)
- Share of adults who drink sugar-sweetened beverages daily (lower is better)
- Share of households facing food insecurity (lower is better)
- Share of adults with overweight or obesity (lower is better)
- Share of adults with a history of diabetes (lower is better)
- Share of adults with a history of high cholesterol (lower is better)
- Share of adults with a history of high blood pressure (lower is better)
- Share of adults with a history of coronary heart disease or heart attack (lower is better)
Due to limitations with the CDC data, not all states report data on each factor every year. Because of this, the latest available data was used for each state. In the event of a tie, the state with the higher percentage of adults who consume fruits daily was ranked higher.


Add a Comment